
- How Much Do You Need to Retire? Social Security, Pensions, RMDs (you are here)
- Social Security Replacement Rate Explained
- 12% Tax Bracket: Filling It in Early Retirement at 62
A simple rule of thumb says you need about 25 times the amount your investments must pay you each year. That yearly amount is your spending minus Social Security and any pension. When you start Social Security, and in what order you draw from pre-tax accounts before the government forces withdrawals, can change a household’s lifetime income and tax bill by six figures. These are timing choices, and getting them right costs nothing if you plan early.
Why it matters: When you make these choices can change your income for life.
Summary: You need roughly 25 times the yearly spending your portfolio itself must supply, after Social Security and any pension are subtracted. When you claim Social Security and how you draw down pre-tax accounts before required minimum distributions begin can move a household’s lifetime income and tax bill by six figures.
- Estimate spending from your own expenses; 70%–80% of gross pay is a rough check, not a plan.
- The 4% rule describes 30-year U.S. history with 50%–75% stocks; longer retirements, fees and taxes call for less.
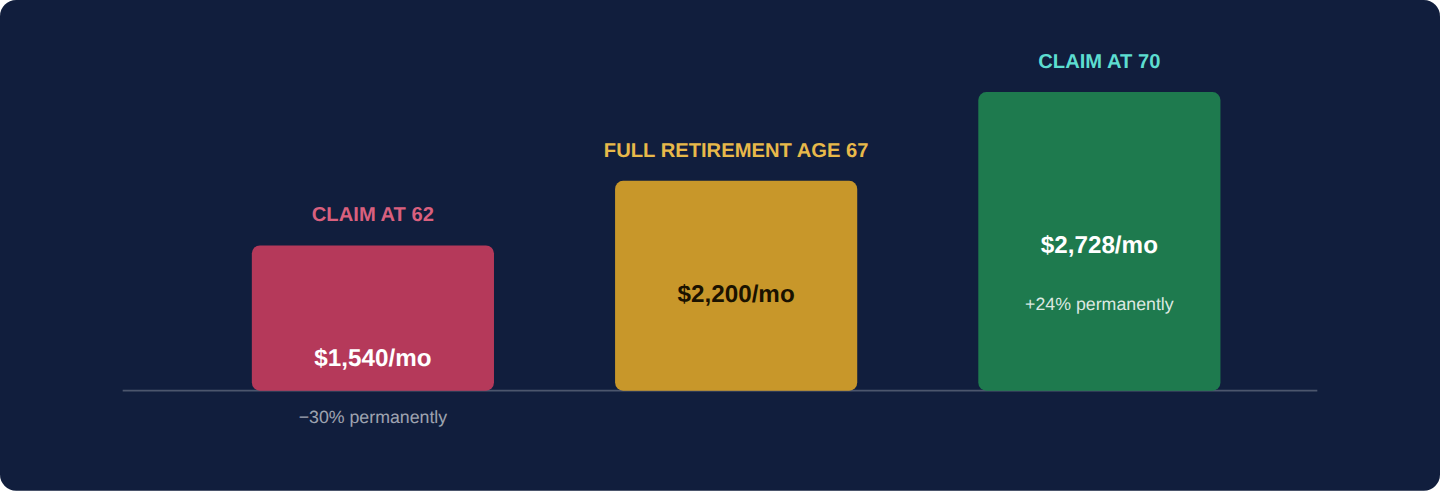
- Social Security replaces a larger share of low earnings than high earnings, and each year of delay from 62 to 70 raises the check for life; the break-even against claiming at 62 is about age 80.
- A pension’s vesting schedule, payout option and inflation protection decide what it is worth.
- The low-income years between retiring and RMDs (73 or 75) are the cheapest time to pay tax on pre-tax money.
Throughout this volume we follow a single filer earning $75,000, early thirties, who takes home $2,163.60 every two weeks; this chapter turns that salary into a retirement target and an estimated Social Security benefit.
There are two ways to estimate retirement spending: from income, which is quick, or from expenses, which is better. Either estimate becomes a portfolio target by the same rule of thumb: roughly 25 times the annual amount the portfolio must supply — 1 ÷ 0.04, the inverse of the 4% withdrawal rate examined in 10.2. At a more cautious 3.5%, the multiple is 1 ÷ 0.035 ≈ 28.6.
The income-replacement heuristic says retirement spending will be about 70%–80% of pre-retirement gross income. It exists because a large slice of a paycheck is never spent on living: of $75,000 gross, $4,500 goes to the 401(k), and federal income tax ($6,108) and FICA (7.65% × $72,400 = $5,538.60, Part 1.6: Paychecks Decoded) also come off the top. Take-home pay is $2,163.60 × 26 = $56,253.60; adding back $2,600 of health premiums gives about $58,854 of living costs — 78% of gross. In retirement, saving and payroll tax disappear, while healthcare (Part 8.2, 10.9: Medicare at 65, IRMAA, and the Pre-65 Health Insurance Gap) tends to grow.
The expense-based method builds the number line by line, separating what you must pay from what you would like to pay; essentials are what a guaranteed income floor should cover (10.7).
| Spending line | Type | In retirement | Why |
|---|---|---|---|
| Payroll tax (FICA) | — | Disappears | Charged on wages only |
| Retirement saving | — | Disappears | You are drawing down now |
| Commuting and work costs | Essential | Falls | No commute, work clothes or bought lunches |
| Housing | Essential | Falls if the mortgage is paid off | Property tax, insurance and repairs continue (Part 5) |
| Healthcare | Essential | Rises | Medicare premiums and cost-sharing (10.9: Medicare at 65, IRMAA, and the Pre-65 Health Insurance Gap) |
| Income tax | Essential | Usually falls, rarely to zero | Traditional withdrawals and some Social Security are taxed (10.5: Sequencing Withdrawals in Retirement, 10.8) |
| Travel and leisure | Discretionary | Often rises early, falls later | More free time while still active |
At 70% of the household’s $75,000 income, estimated retirement spending is $75,000 × 70% = $52,500 per year. At 25 times that figure, the target portfolio is $52,500 × 25 = $1,312,500 — the number Parts 6 and 7 are working toward.
Social Security’s offset. Using the 2026 average retirement benefit of $2,071 a month purely as an illustration (the household’s own benefit depends on its earnings record, 10.3): $2,071 × 12 = $24,852 a year. The portfolio then needs to supply $52,500 − $24,852 = $27,648, and 25 × $27,648 = $691,200. If benefits were cut to the roughly 78% that payroll taxes alone could pay after the trust fund’s projected 2032 depletion (10.3), the gap becomes $52,500 − ($24,852 × 0.78) = $33,115, and the target 25 × $33,115 ≈ $827,900. The $1,312,500 is the conservative ceiling that ignores Social Security; the realistic target, counting Social Security, sits roughly between $691,000 (full scheduled benefits) and $828,000 (a 22% cut).
All of these figures are in today’s dollars — what $52,500 buys now, not what the number on a future statement will read (real versus nominal: see 7.1: Why Investing Differs from Saving and 7.5). For an early-thirties saver retiring at 67, retirement is about 35 years away. At this volume’s standard 3% inflation assumption, the nominal equivalent is $1,312,500 × 1.0335 = $1,312,500 × 2.814 ≈ $3.69 million, supporting first-year spending of $52,500 × 2.814 ≈ $147,700 in that year’s dollars. Both pairs describe the same standard of living. Comparing a nominal portfolio projection with a today’s-dollar spending target makes a plan look far better funded than it is.
The 70%–80% heuristic assumes a typical saver with a typical tax bill. It overstates the need for someone who saved 25% of pay and understates it for a low saver, for anyone still paying rent or a mortgage, and for anyone retiring before 65 who must buy health coverage until Medicare (10.9: Medicare at 65, IRMAA, and the Pre-65 Health Insurance Gap). The 25× multiple assumes a 30-year retirement and untaxed spending money; a 40-year retirement or a large pre-tax balance (10.5: Sequencing Withdrawals in Retirement) needs more. Your own last twelve months of spending, adjusted with the table above, beats any ratio.
The 4% rule, originating from financial planner William Bengen’s research in the 1990s, holds that withdrawing 4% of a portfolio’s value in the first year of retirement, then adjusting that dollar amount for inflation every year after, historically survived every rolling 30-year period in U.S. market history without running out of money.

The 4% figure is a historical observation, not a law of physics, and has drawn serious criticism: some researchers argue that higher valuations and lower expected future returns justify a more conservative starting rate somewhat below 4% for today’s retirees (see the box below); others advocate dynamic strategies — adjusting spending up in good market years and down in bad ones, rather than a fixed inflation-adjusted dollar amount regardless of how the portfolio actually performs. There is no single settled answer, and a retiree’s actual safe rate depends heavily on retirement length, portfolio composition (Part 7.4), and real flexibility to cut spending if markets turn early in retirement.
The standard view: William Bengen’s 1994 study of U.S. market history found that a 4% first-year withdrawal, raised with inflation each year, survived every 30-year retirement since 1926 with a portfolio of 50%–75% stocks; the 1998 “Trinity study” by three Trinity University professors reached similar conclusions with different data. Its assumptions: a 30-year horizon; 50%–75% in stocks, the rest in bonds; historical U.S. returns, among the strongest of any country’s; spending that never adjusts to markets; and no fees or taxes. The alternative: lower fixed rates for longer retirements or when expected returns are lower; dynamic rules such as guardrails (10.7) that start higher and cut after bad years; and “floor and upside” plans that cover essentials with guaranteed income, so the withdrawal-rate question applies only to discretionary spending. What the evidence says: Morningstar’s annual study, which uses forward-looking return forecasts rather than history, put the highest safe starting rate for a 30-year retirement at 3.9% in its Dec 2025 report (90% probability of success, 30%–50% in stocks), up from 3.7% a year earlier; the same research finds that flexible spending methods support materially higher starting rates in exchange for income that varies. Studies applying Bengen’s test to other countries’ market histories have generally found lower safe rates than U.S. history alone suggests. What remains open: how well today’s valuations predict the next 30 years; how willing real retirees are to cut spending when markets fall; and what rate suits retirements of 35 or 40 years.
The 4% rule needs adjusting when the retirement is longer than 30 years — someone retiring at 50 is planning for 40 or more; when the first decade brings poor returns (10.7’s worked example shows why); when fees take their cut — a 1% annual fee consumes a quarter of a 4% withdrawal; when spending is lumpy, with a roof, a car, or care costs on top of the plan; when the portfolio is far more conservative or aggressive than 50%–75% stocks; and when the 4% is treated as spendable after-tax money, although withdrawals from traditional accounts are taxed as income (10.5: Sequencing Withdrawals in Retirement). It also fails in the other direction: retirees who follow it rigidly through good markets often die with more than they started with, having spent less than they could have.
Social Security calculates a benefit from a worker’s highest 35 years of earnings, indexed to growth in national average wages, producing a Primary Insurance Amount (PIA) — the monthly benefit payable at Full Retirement Age (FRA), which is 67 for anyone born in 1960 or later. Claiming earlier or later than FRA permanently adjusts the benefit up or down.
| Social Security in 2026 | Figure |
|---|---|
| Cost-of-living adjustment | 2.8% |
| Maximum earnings taxed (wage base) | $184,500 |
| Earnings-test limit, under full retirement age all year | $24,480 ($1 withheld per $2 above it) |
| Earnings-test limit, year you reach full retirement age | $65,160 ($1 withheld per $3 above it) |
| Maximum benefit at full retirement age | about $4,152 a month |
| Average retirement benefit | $2,071 a month |
| Delayed retirement credit, 67 to 70 | 8% a year (24% in total) |
Four questions on this chapter. Decide on your answer first, then click “Reveal Answer.”
1. A couple estimates retirement spending of $60,000 a year in today’s dollars and expects $24,000 a year from Social Security. Using the 25× rule, what portfolio target do they need?
- $900,000
- $1,476,000
- $1,029,600
- $1,500,000
Reveal Answer
Answer: A. Multiply only what the portfolio must supply: 25 × ($60,000 − $24,000) = $900,000. $1,500,000 ignores Social Security, $1,476,000 subtracts the benefit from the target instead of from spending, and $1,029,600 uses the cautious 28.6 multiple. (Part 10.1: How Much Do You Actually Need?)
2. Which of these retirees has the strongest case for starting withdrawals below the classic 4% rate?
- A 65-year-old with 60% in stocks and a 30-year horizon
- A 50-year-old planning for a retirement of 40 years or more
- A retiree ready to cut spending after bad market years
- A retiree whose essentials are covered by guaranteed income
Reveal Answer
Answer: B. Bengen’s 4% assumed a 30-year horizon and 50%–75% stocks, so a 40-year retirement needs a lower fixed rate. Flexible spending and a guaranteed floor support higher starting rates, not lower ones. (Part 10.2)
3. Worked problem: A retiree wants $60,000 a year and Social Security provides $24,000. Using the 4% rule, how large a portfolio is needed?
Reveal Answer
Answer: Gap = $36,000. Portfolio = $36,000 ÷ 0.04 = $900,000.
4. Worked problem: Someone earning $90,000 wants to replace 80% of it, with $30,000 from Social Security. What portfolio does the 4% rule imply?
Reveal Answer
Answer: Target = $72,000; gap = $42,000; portfolio = $42,000 × 25 = $1,050,000.
- Required minimum distribution FAQs — RMD ages
- 2026 Trustees Report — Trust fund projections
- Retirement earnings test exempt amounts — 2026 earnings-test limits
- Latest cost-of-living adjustment — 2026 COLA
- Benefits planner: born in 1960 or later — Reductions and spousal percentages
- 26 U.S.C. §411(a)(2)(A)