
- Budgeting and Emergency Fund Basics for Personal Finance (you are here)
- How to Build an Emergency Fund on a Timeline
Think of your money as a bathtub. Net worth is how much water is in the tub right now: what you own minus what you owe. Cash flow is the tap and the drain: what comes in minus what goes out each month. A budget is simply a plan for the drain, made before the month starts. An emergency fund is a reserve tank that covers essential bills for a few months if the tap stops. Setting transfers to happen automatically on payday means saving works even when willpower doesn’t.
Why it matters: A bad month then becomes an inconvenience instead of a credit card balance.
Summary: Two statements tell you where you stand: net worth (what you own minus what you owe, at one moment) and cash flow (what comes in minus what goes out, over a month or a year). A budget is the cash flow statement written in advance, an emergency fund of three to six months of essential expenses keeps one bad month from turning into debt, and automation makes both happen on payday without willpower.
- Net worth = total assets − total liabilities. Judge the quarterly trend, and remember that a traditional 401(k) balance still owes income tax.
- 50/30/20 splits take-home pay into needs, wants and savings: on a $2,163.60 paycheck, $1,081.80, $649.08 and $432.72.
- Size the emergency fund in months of needs, not income: three months is $7,031.70 for the running household, six months $14,063.40.
- The months come from job-search data: the median unemployed person had been looking for 11.5 weeks in September 2026, the average 24.8 weeks.
- Automate the amount you actually want to save. In a classic study, automatic enrollment lifted 401(k) participation from 37% to 86%, but most people then stayed at the low default rate.
- Do not use a 401(k) as the emergency fund: in the 22% bracket, an early withdrawal loses 32 cents of every dollar to tax and penalty before any growth is lost.
Throughout this volume we follow a single filer earning $75,000, paid biweekly: $2,884.62 gross and $2,163.60 net per paycheck, assuming no state income tax (1.6: Paychecks Decoded).
Vol. I’s Part 5 taught two financial statements every company publishes: an income statement (revenue minus expenses, over a period of time) and a balance sheet (assets minus liabilities, at a single point in time). A household has exact equivalents, and building them — on paper, for real, with your own numbers — is the single most useful half hour of personal finance most people never actually spend.
| Company Statement (Vol. I, Part 5) | Personal Equivalent | What It Answers |
|---|---|---|
| Income Statement — revenue, expenses, net profit over a quarter or year | Personal Cash Flow Statement — income, expenses, net savings over a month or year | Am I spending less than I earn, and by how much? |
| Balance Sheet — assets, liabilities, shareholders’ equity at a point in time | Net Worth Statement — assets, liabilities, net worth at a point in time | What am I actually worth, all debts included? |
| Cash Flow Statement — where cash actually moved, distinct from accrual profit | Bank & Card Statements — where cash actually moved, distinct from budgeted intent | Did my plan survive contact with the month? |
A company that never produced financial statements would have no idea whether it was solvent, growing, or slowly failing — it would simply feel however the bank balance happened to feel on any given day. Most households run exactly this way, and for the same reason it would be reckless for a company: without the statement, a bad trend and a temporarily tight month are indistinguishable from the inside.
You don’t need software or an accountant’s precision to build either statement — a spreadsheet or even a sheet of paper works, and both are rebuilt fully in the sections immediately below: 1.2 builds the personal balance sheet in detail, and 1.3 builds the cash flow statement through the lens of an actual budgeting method.
Net worth is the single most revealing number in personal finance, precisely because income can’t hide from it. A high income with high debt and no savings can produce a lower net worth than a modest income that has been saved and invested consistently for a decade — income measures what flows past you, net worth measures what actually stuck.
The statement has exactly two sides, mirroring Vol. I’s corporate balance sheet exactly:
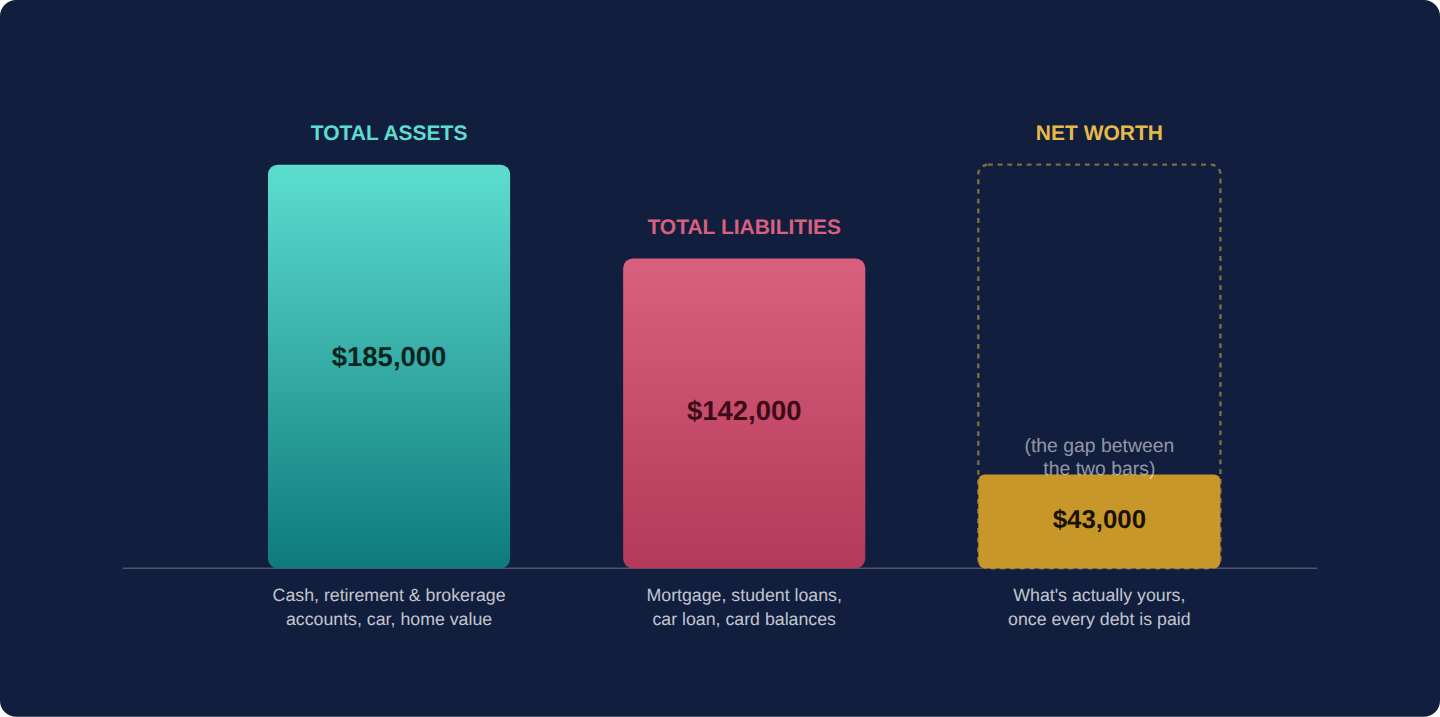
- Assets — everything you own that has monetary value: cash and checking/savings balances, the current value of retirement and brokerage accounts, a home’s market value, a car’s resale value.
- Liabilities — everything you owe: mortgage balance, student loan balance, car loan balance, credit card balances.
Net Worth = Total Assets − Total Liabilities. That’s the entire formula — the discipline is in listing every line accurately, including the ones that are uncomfortable to look at.
A balance sheet values each line at what it would turn into today, net of any claim on it. Three lines on a household statement usually carry a claim the statement does not show:
- Traditional 401(k) and IRA balances are pre-tax: every dollar withdrawn is taxed as ordinary income (6.3). At an assumed 15% average tax rate on withdrawal, a $40,000 traditional balance is worth $40,000 × (1 − 0.15) = $34,000 to spend; a $40,000 Roth balance is worth the full $40,000. Two households with identical statements can own different amounts.
- A home is worth its sale price minus the cost of selling. At an assumed 6% for commissions and closing costs, a $300,000 home turns into $300,000 × (1 − 0.06) = $282,000 before the mortgage is repaid.
- A car is worth its private-party resale value, not its purchase price, and that value falls every year the loan is being paid down.
The rule: list market values on the statement, and add one memo line underneath with the estimated tax and selling costs if most of your assets are pre-tax accounts or a home. Then value each line the same way every quarter.
A negative net worth — common, and not catastrophic, in the years right after taking on student loans or a first mortgage — is not a crisis in itself. What matters is the trend line, recalculated on the same schedule (quarterly is enough) with the same honesty every time. A net worth that is negative but rising is a household doing exactly the right thing; a net worth that is positive but falling is a household that should stop and ask why, regardless of how large the number still looks in isolation.
Build the statement once, today, even roughly — then put a recurring calendar reminder for the same day every quarter to update it. The first statement is the only hard one; every one after it is a five-minute copy-and-update, and the trend it reveals over a year or two is worth far more than the precision of any single snapshot.
A budget is simply a personal cash flow statement written in advance instead of reconstructed after the fact — a plan for where income will go, made before it arrives rather than discovered afterward in a bank statement. Three methods cover the large majority of how people actually do this successfully; none is objectively best, and each fits a different kind of person and situation.
| Method | How It Works | Best Suited For |
|---|---|---|
| 50/30/20 Rule | 50% of take-home pay to needs (housing, groceries, utilities, minimum debt payments), 30% to wants, 20% to savings and extra debt paydown | People who want a simple, proportional starting framework without tracking every category in detail |
| Zero-Based Budgeting | Every dollar of income is assigned a specific job — spending, saving, or debt paydown — before the month begins, until income minus all assignments equals exactly zero | People who want maximum control and visibility, or who are actively digging out of debt or living on a tight or variable income |
| Pay-Yourself-First | A fixed savings percentage is automatically diverted the moment income arrives, before any spending happens; whatever’s left is spent freely with no category tracking | People who have already hit their savings targets and want to spend the rest without friction, or who find detailed tracking unsustainable |
Using the paycheck built out fully in 1.6 below — a $75,000 salary paid biweekly, netting $2,163.60 per paycheck after federal taxes and pre-tax deductions (no state income tax is assumed; 1.6 shows the adjustment) — the 50/30/20 split works out to:
Needs (50%): $1,081.80 per paycheck — rent or mortgage, groceries, utilities, minimum debt payments, insurance premiums.
Wants (30%): $649.08 per paycheck — dining out, entertainment, subscriptions, discretionary shopping.
Savings & extra debt paydown (20%): $432.72 per paycheck — emergency fund, brokerage investing, extra principal payments beyond the 6% already going to the 401(k) in this example.
Over a full year of 26 paychecks, that 20% alone is $11,250.72 — before counting the 401(k) contributions already leaving the paycheck pre-tax.
Vol. III’s Part 6, Behavioral Finance, covers mental accounting — the human tendency to treat money differently depending on which mental “bucket” it’s assigned to, even though a dollar is a dollar regardless of its source or label. A budget is mental accounting used deliberately, for good: assigning money to a bucket before it can be spent unconsciously is precisely what makes any of these three methods work better than no method at all.
Why the rule exists: 50/30/20 was popularized by Elizabeth Warren and Amelia Warren Tyagi in their 2005 book All Your Worth as a budget simple enough to keep. Its assumptions: needs fit inside half of take-home pay, and the 20% is the whole of saving. Where it fails: housing. This household’s needs bucket is $1,081.80 × 26 ÷ 12 = $2,343.90 a month. Rent at 30% of gross income — the line above which HUD calls a renter “cost-burdened” — would be $75,000 ÷ 12 × 30% = $1,875, leaving $2,343.90 − $1,875 = $468.90 for groceries, utilities, insurance, transport and minimum payments. In many cities needs will exceed 50%; fund the overflow from wants rather than from the 20%, and read the split as a direction, not a test. At higher incomes the reverse holds and 20% can be too little. Nor is the 20% this household’s true savings rate: adding the pre-tax 401(k) and employer match, it saves $11,250.72 + $4,500 + $2,250 = $18,000.72 a year, 24.0% of gross salary. Section 1.8: The Financial Order of Operations: Where the Next Dollar Should Go sets the order in which the 20% is spent.
An emergency fund is cash held specifically to absorb a real financial shock — job loss, an urgent medical bill, a major car or home repair — without being forced to reach for a credit card or interrupt long-term investments at a bad moment. The standard guidance is three to six months of essential expenses (the “needs” category from 1.3, not total income), held somewhere safe and immediately accessible rather than invested for growth.
- Three months is generally enough for a household with dual incomes, stable employment, and good insurance coverage (Part 8 builds the insurance side of this equation in full).
- Six months or more is more appropriate for a single income, commission-based or freelance income (Part 11.5 covers this specifically), or a household supporting dependents with no other income backstop.
- Where to keep it: a high-yield savings account or a money market deposit account (or a government money market fund, which is not FDIC-insured — see 2.7) — not a checking account, where it quietly gets spent, and not a brokerage account, where it can lose value at exactly the moment it’s needed most.
The fund replaces a paycheck that has stopped, but not the whole paycheck. When pay stops, so do the 401(k) contribution, income tax withholding and FICA, and wants can be cut. What has to continue is the needs bucket: $1,081.80 × 26 ÷ 12 = $2,343.90 a month for the running household, against gross pay of $75,000 ÷ 12 = $6,250. Three months of needs is $7,031.70; three months of gross pay would be $18,750, more than two and a half times as much cash earning a savings rate.
The number of months comes from how long job searches last. In the Bureau of Labor Statistics’ Current Population Survey, the median unemployed person in September 2026 had been out of work for 11.5 weeks, about 11.5 × 12 ÷ 52 = 2.7 months; the mean, pulled up by long spells, was 24.8 weeks, about 24.8 × 12 ÷ 52 = 5.7 months. Both measure spells still in progress when the survey asks: each counted spell will end up longer than recorded, although a single-month snapshot also over-represents long spells. Three months covers a typical search; six covers the average one. Unemployment insurance narrows the gap without closing it: state formulas generally aim to replace around half of prior wages, subject to a weekly maximum, and the benefits are taxable (11.4).
The Federal Reserve’s Survey of Household Economics and Decisionmaking for 2025, published May 13, 2026, found that 63% of adults would cover a hypothetical $400 emergency expense using only cash, savings or a credit card paid off at the next statement, and 55% had emergency savings that would cover three months of expenses, the same as in 2024 and up from 47% in 2015. Read the other way, about 45% of adults could not cover three months from savings. The evidence on the ideal size of the fund is thin: three to six months is a planning convention, not a research finding, and the job-search data above is the most direct anchor for it.
An emergency fund is insurance you sell yourself. A traditional insurance policy (Part 8) pools risk across thousands of strangers so any one person’s disaster is absorbed by everyone’s premiums. A self-funded emergency reserve does the same job for the risks that are either too small, too frequent, or too specific to insure economically — a broken transmission, a month between jobs, a surprise dental bill. You are, in effect, both the insurer and the insured.
Four questions on this chapter. Decide on your answer first, then click “Reveal Answer.”
1. Household A’s net worth went from −$12,000 to −$4,000 over the past year. Household B’s went from $90,000 to $82,000. How should each read its own trend?
- B is fine, because its net worth is still large and positive
- Neither can tell, since net worth only matters as a share of income
- A is on track; B should stop and find out why it is falling
- A is in trouble, because any negative net worth is a crisis
Reveal Answer
Answer: C. The trend line, recalculated on the same schedule, is what counts: negative but rising is a household doing the right thing, while positive but falling calls for a closer look however big the number looks. (Part 1.2)
2. The $75,000 household nets $2,163.60 per biweekly paycheck and pays rent equal to 30% of its gross monthly income. Under 50/30/20, how much of the monthly needs bucket is left for groceries, utilities, insurance, transport and minimum payments?
- $288.60
- $937.56
- $1,250.00
- $468.90
Reveal Answer
Answer: D. Needs = $1,081.80 × 26 ÷ 12 = $2,343.90 a month; rent = $75,000 ÷ 12 × 30% = $1,875; $2,343.90 − $1,875 = $468.90. Counting two paychecks a month, or taking 30% of net or 50% of gross, gives the other figures. (Part 1.3)
3. For the running household, three months of needs is $7,031.70 while three months of gross pay is $18,750. Why does the volume size the emergency fund on needs rather than gross pay?
- Unemployment insurance replaces gross pay in full for three months
- Gross pay overstates income because of the employer match
- When pay stops, 401(k) deferrals, taxes and wants stop or can be cut
- Federal rules cap emergency savings at three months of essential expenses
Reveal Answer
Answer: C. The fund replaces a stopped paycheck, but contributions, withholding and FICA stop with it and wants can be cut; only needs of $1,081.80 × 26 ÷ 12 = $2,343.90 a month must continue, so 3 × $2,343.90 = $7,031.70. (Part 1.4)
4. Worked problem: The goal is a six-month emergency fund based on needs. How large is the target, and how long does it take at $560 a month?
Reveal Answer
Answer: Target = 6 × $1,400 = $8,400. Time = $8,400 ÷ $560 = 15 months.