
7.3 The Problem of Ratings Divergence
ESG ratings for the same company agree far less than credit ratings do. Across the major providers they correlate only about 0.38 to 0.71, against roughly 0.99 for credit ratings. Most of the disagreement comes from measuring the same issues with different indicators, not from giving the issues different weights.
Why it matters: Check which rating you are using before comparing two companies.
Summary: ESG ratings for the same company correlate only about 0.38 to 0.71 across major providers, against roughly 0.99 for credit ratings. Most of the disagreement comes from measuring the same issues with different indicators, not from different weights.
- Berg, Kölbel and Rigobon attribute 56% of divergence to measurement, 38% to scope and 6% to weights.
- A rater effect means disagreement is systematic, so averaging two ratings does not cancel it.
- In the worked example, a different emissions measure explains 69% of a 1.45-point gap between two raters.
- Since July 2, 2026, the EU requires ESMA authorization for ESG rating providers.
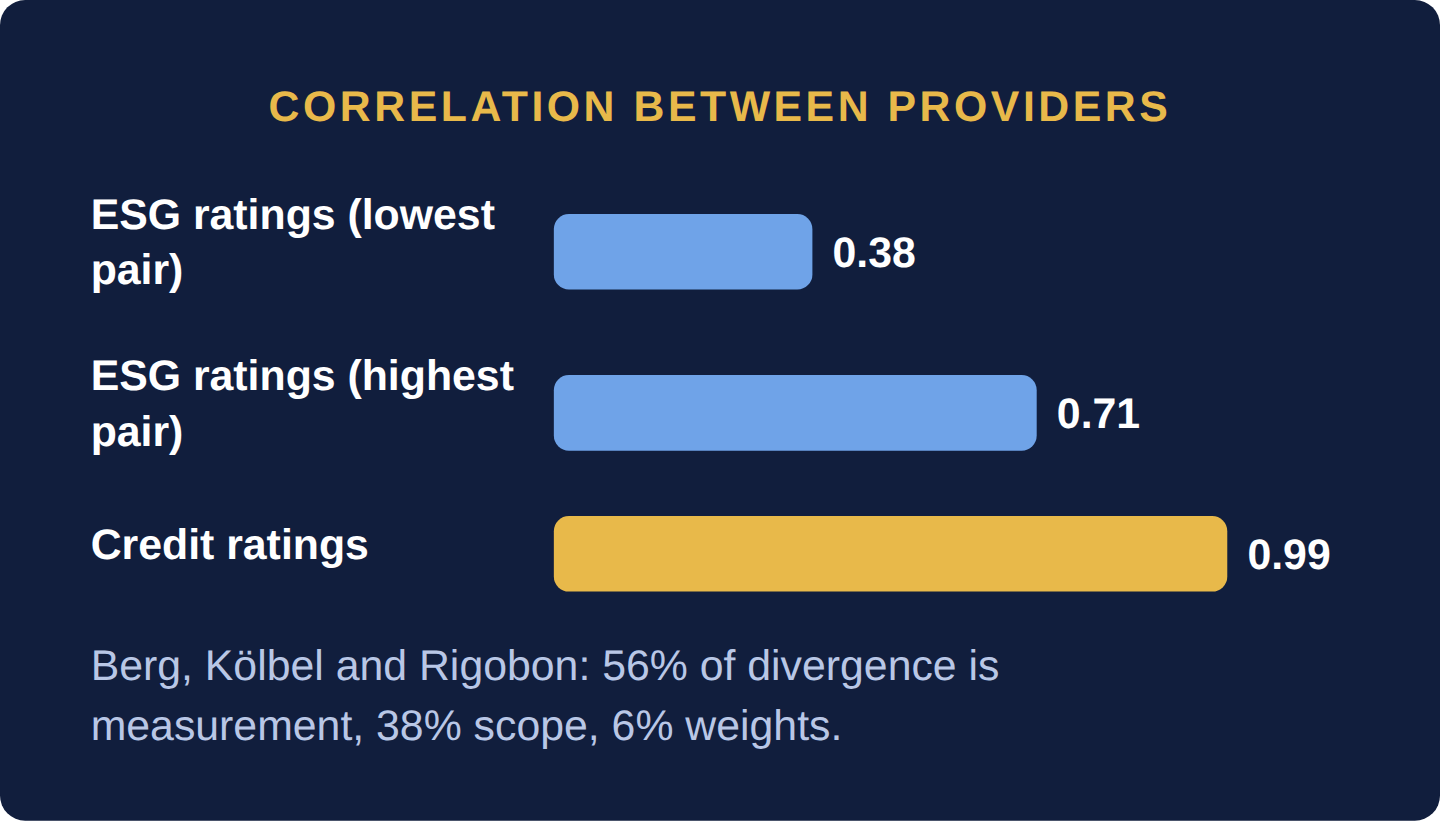
Unlike traditional credit ratings (Capital Markets Part 3), where the major agencies usually land on the same grade for a given bond, ESG ratings for the same company often disagree. The best-known measurement is Berg, Kölbel and Rigobon, “Aggregate Confusion: The Divergence of ESG Ratings” (Review of Finance, 2022). Across six major providers, pairwise correlations of ESG ratings ranged from 0.38 to 0.71; in the working-paper version the authors set this against a 0.994 correlation between Moody’s and S&P credit ratings. A correlation near 0.5 means that a company in one provider’s top quintile is often in another provider’s middle of the pack.
The paper decomposes the disagreement into three sources. Scope divergence (raters count different issues, say one includes lobbying and another does not) explains 38%. Measurement divergence (raters measure the same issue with different indicators, say labor practices by turnover versus by number of lawsuits) explains 56%. Weight divergence explains only 6%. The authors also find a “rater effect”: a rater’s overall view of a firm leaks into its scores for specific categories, so disagreement is structural rather than random noise that averages out.
Take one company with pillar scores (0 to 10) of Social 7 and Governance 8. Rater A measures Environmental at 4 using the company’s disclosed emissions and weights the pillars 50/20/30. Rater B uses a vendor emissions estimate that puts Environmental at 6.
- Rater A: 4 × 0.5 + 7 × 0.2 + 8 × 0.3 = 2.0 + 1.4 + 2.4 = 5.8.
- Rater B with A’s weights: 6 × 0.5 + 7 × 0.2 + 8 × 0.3 = 6.8. Measurement alone moved the score by 1.0.
- Rater B with its own weights of 25/25/50: 6 × 0.25 + 7 × 0.25 + 8 × 0.5 = 1.5 + 1.75 + 4.0 = 7.25. Weights added a further 0.45.
Of the 1.45-point gap, 1.0 ÷ 1.45 = 69% comes from measuring one pillar differently, close to the 56% the study finds for measurement. Agreeing on weights would not have closed the gap; agreeing on the data would have closed most of it. That is why the policy response has focused on standardizing disclosures (Section 7.2: How ESG Ratings Are Constructed) and on making raters explain their methods, not on dictating weights.
Regulators have started to treat ratings themselves as a product to supervise. The EU’s ESG Ratings Regulation (Regulation (EU) 2024/3005) has applied since July 2, 2026: providers offering ratings in the EU need ESMA authorization and are listed on a public register, with a transitional regime for providers already operating and a lighter regime for small ones. The United States has no equivalent. The regulation will not make ratings agree; its aim is that users can see why they differ.
This divergence is precisely why sophisticated institutional investors increasingly build their own proprietary ESG assessment frameworks rather than relying on a single external rating provider’s score in isolation — treating any single ESG rating the way a careful credit analyst treats any single rating agency’s opinion: as one input to weigh, not an unquestionable final verdict.
Treat a single ESG rating as one opinion, never as a fact. If two providers place a company more than one quintile apart, do not average them: find the pillar where they disagree and check the underlying data yourself, usually emissions, controversies or labor indicators. If you are building an index or screen, test whether your holdings change when you swap providers; if more than about a quarter of names change, the screen is measuring the provider’s method, not the companies. The thresholds are rules of thumb; they matter less for a narrow screen built on one hard metric, such as reported Scope 1 and 2 emissions, where the data rather than the provider drives the result.
Assuming disagreement is random noise that averages away. The study’s rater effect shows it is systematic, so averaging two biased raters gives a biased average. In the example above, averaging Rater A (5.8) and Rater B (7.25) gives 6.5, a score that rests on neither the disclosed nor the estimated emissions figure. An investor who sets a cut-off of 6.0 on the average buys the company; one who checks the data and finds the disclosed emissions behind Rater A’s 4.0 does not. The fix is to resolve the measurement question, not to blend the outputs.
Why do ESG ratings differ so much between providers?
Mostly because they measure the same issues with different indicators (56% of the divergence in the Berg, Kölbel and Rigobon study), then because they include different issues (38%). Different weights explain only about 6%. Providers also differ on whether they grade against industry peers or on an absolute scale (Section 7.2: How ESG Ratings Are Constructed).
Are ESG ratings regulated?
In the EU, yes: since July 2, 2026, ESG rating providers need ESMA authorization under Regulation (EU) 2024/3005, with transitional arrangements for existing providers. In the United States there is no specific ESG rating regulation; ordinary securities law applies to how ratings are used in fund marketing.
Which ESG rating is the most accurate?
None can be called the most accurate, because there is no agreed definition of what they should measure. A rating can only be judged against its own stated purpose: financial risk relative to peers, absolute unmanaged risk, or impact. Choose the one whose purpose matches your question and check its data sources.
ESG ratings for the same company diverge far more than credit ratings, mainly because providers measure the same issues with different indicators, and a rater effect makes the disagreement systematic. Treat any rating as one opinion, resolve disagreements by checking the underlying data, and note that since July 2026 the EU supervises rating providers.
Six questions on this chapter. Decide on your answer first, then click “Reveal Answer.”
1. In Berg, Kölbel and Rigobon’s decomposition, which source explains the largest share of ESG rating divergence?
- Measurement differences, at about 56%
- Scope differences, at about 56%
- Weighting differences, at about 56%
- Undisclosed rater errors, at about 56%
Reveal Answer
Answer: A. Measurement explains 56%, scope 38% and weights only 6%.
2. A rater weights E, S and G at 50%, 20% and 30%. A company scores E 5, S 6 and G 8. What is its composite score?
- 5.8
- 6.1
- 6.3
- 6.6
Reveal Answer
Answer: B. 5 × 0.5 + 6 × 0.2 + 8 × 0.3 = 2.5 + 1.2 + 2.4 = 6.1.
3. What changed for ESG rating providers in the EU on July 2, 2026?
- Their ratings must all use the same weights
- They must stop rating non-EU companies
- They need ESMA authorization to offer ratings
- Their ratings must converge on a single score
Reveal Answer
Answer: C. Regulation (EU) 2024/3005 applies from July 2, 2026; providers need ESMA authorization and appear on a public register, with transitional and small-provider regimes.
4. Two providers place the same company two quintiles apart. What does the chapter’s decision rule advise?
- Average the two scores and use the result
- Use whichever provider is larger by coverage
- Drop the company from the investable universe entirely
- Find the pillar where they differ; check its data
Reveal Answer
Answer: D. Divergence is systematic, not noise, so averaging carries both biases; resolving the measurement question is the fix.
5. Worked problem: Ratings of the same companies correlate at 0.38 across two ESG providers and 0.99 across credit rating agencies. What share of variation is shared in each case (r²)?
Reveal Answer
Answer: ESG: 0.38² = 14%. Credit: 0.99² = 98%.
6. Worked problem: Researchers attribute 56% of the divergence to measurement, 38% to scope and 6% to weights. If total divergence is 100 units, how many are due to measurement?
Reveal Answer
Answer: 56 units; scope 38; weights 6.
7.4 Green Bonds
A green bond is an ordinary bond whose issuer promises to spend an amount equal to the proceeds on eligible environmental projects, and to report on it. The credit risk is the issuer’s, as with any bond. The green label changes the disclosure, and sometimes the price by a few basis points, but not the repayment.
Why it matters: A green label makes the use of the money more transparent, not the bond safer.
Summary: A green bond is an ordinary bond whose issuer commits to apply an amount equal to the proceeds to eligible environmental projects and to report on it. Its credit risk is the issuer’s; the label changes disclosure, and sometimes price by a few basis points, not repayment.
- The ICMA Green Bond Principles have four core components: use of proceeds, project selection, management of proceeds and reporting.
- Taxonomies define what counts as green; the EU Taxonomy requires substantial contribution, no significant harm and minimum safeguards.
- The European Green Bond Standard requires at least 85% of proceeds in taxonomy-aligned activities.
- Measured greeniums range from about zero (US municipal pairs) to 5 to 6 bps (India’s 2023 sovereign debut).
- In the worked example the label breaks even at a greenium of about 1.6 bps on a $500 million, 10-year bond.
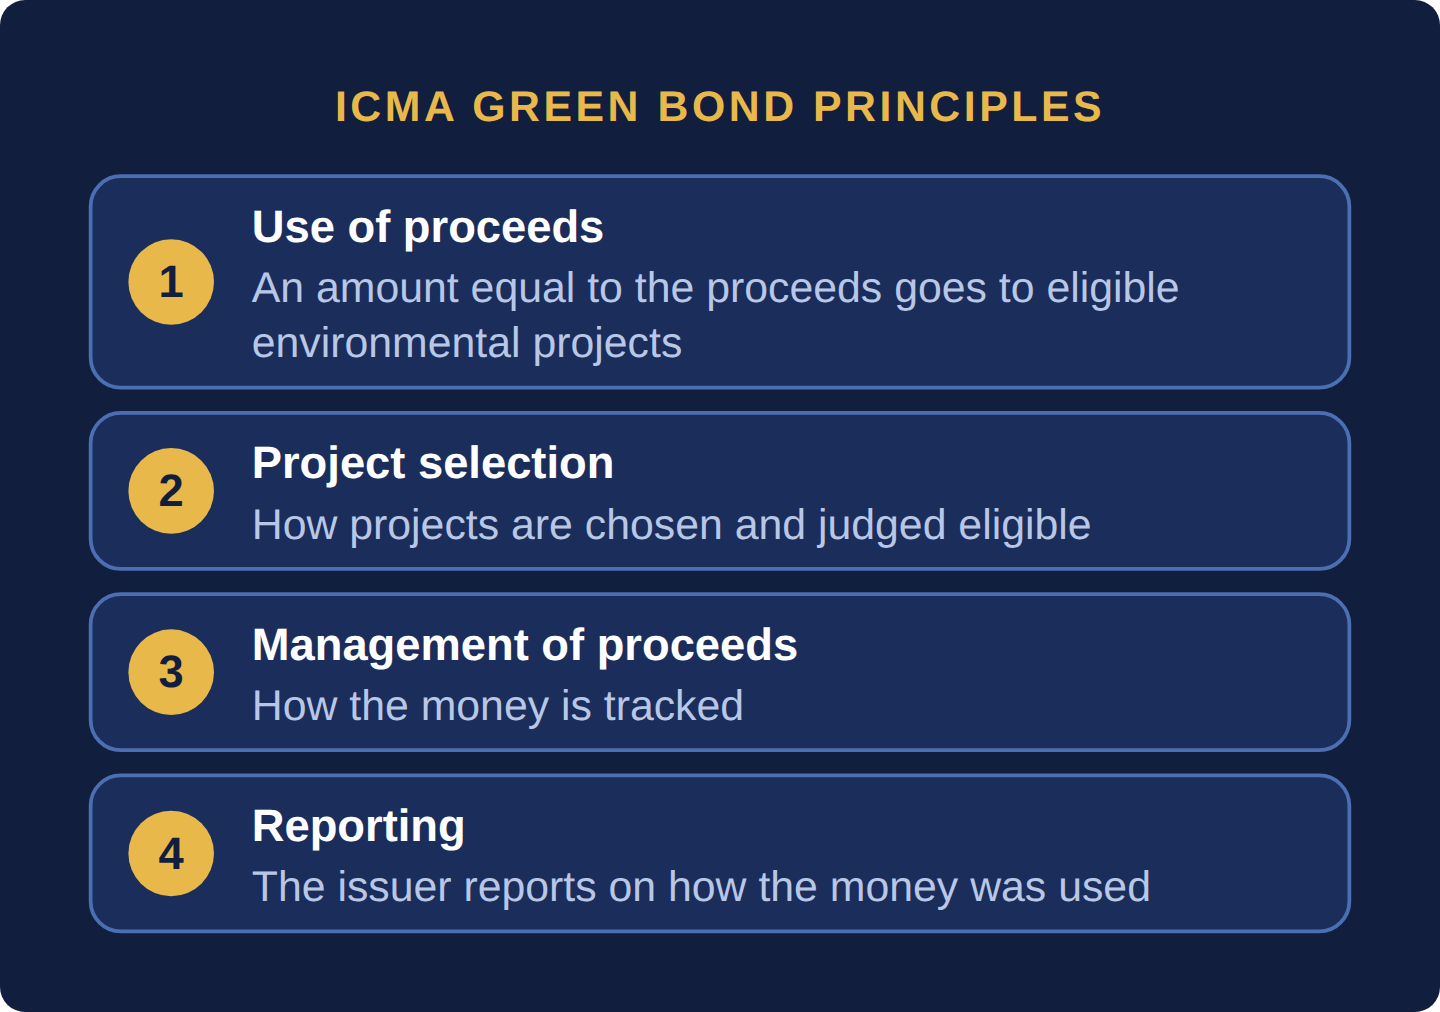
A green bond is an ordinary bond (Capital Markets Part 3’s pricing and structure apply unchanged) with one added promise: the issuer will apply the proceeds, or an equal amount, to eligible environmental projects such as renewable energy, energy-efficient buildings and clean transportation. This is the use-of-proceeds model. Repayment still depends on the issuer’s whole balance sheet: a green bond from a weak issuer is exactly as risky as that issuer’s other bonds of the same seniority, and holders have no claim on the green assets. Money is fungible, so the commitment is about tracking, not about locking cash in a box: under the ICMA Green Bond Principles, the net proceeds “or an amount equal to these net proceeds” should be credited to a sub-account, moved to a sub-portfolio or otherwise tracked, and reported on, often with an external review.
The Principles are voluntary process guidelines with four core components: use of proceeds, the process for project evaluation and selection, management of proceeds, and reporting. They say what an issuer must disclose, not which projects count as green. That second question is answered by a taxonomy, a rulebook that classifies economic activities. The EU Taxonomy (Regulation (EU) 2020/852) names six environmental objectives: climate change mitigation, climate change adaptation, water and marine resources, the circular economy, pollution prevention and control, and biodiversity and ecosystems. An activity is taxonomy-aligned only if it makes a substantial contribution to one objective under technical screening criteria, does no significant harm (DNSH) to the other five, and meets minimum social safeguards. The voluntary European Green Bond Standard (Regulation (EU) 2023/2631, applying since December 21, 2024) turns that into a label: at least 85% of proceeds must go to taxonomy-aligned activities, with ESMA-supervised external reviewers. The United States has no federal taxonomy; US issuers, including many municipalities, rely on the ICMA Principles and private certification.
Does green labeling make borrowing cheaper? The lower yield investors accept on a green bond compared with an otherwise identical conventional bond of the same issuer is the greenium. The evidence says it is small and depends on the market. Larcker and Watts, “Where’s the Greenium?” (2019; summary), compared green and conventional US municipal bonds priced by the same issuer on the same day and found an average yield difference of 0.01 basis points, essentially zero, while underwriting fees on the green bonds were higher. India’s first sovereign green bonds in January 2023 cleared 5 to 6 basis points below comparable government bonds (India Lens). Pástor, Stambaugh and Taylor (NBER, 2021) show that German green government bonds outperformed their conventional twins as the greenium widened, which is a reminder that a greenium can change after issue.
A US utility plans a $500 million, 10-year bond. Labeling it green adds an assumed $150,000 up front (framework, second-party opinion, legal) and $60,000 a year (allocation and impact reporting, verification). Savings and costs are discounted at 5%, so the 10-year annuity factor is (1 − 1.05−10) ÷ 0.05 = 7.7217. Present value of costs = 150,000 + 60,000 × 7.7217 = $613,304.
| Scenario | Greenium | Annual saving = $500m × greenium | PV of savings (× 7.7217) | Net value of the label |
|---|---|---|---|---|
| A: US municipal evidence | 0 bps | $0 | $0 | −$613,304 |
| B: Modest demand | 2 bps | $100,000 | $772,173 | +$158,869 |
| C: India sovereign debut | 6 bps | $300,000 | $2,316,520 | +$1,703,216 |
Break-even. The label pays for itself when greenium × $500 million × 7.7217 = $613,304, so greenium = 613,304 ÷ (500,000,000 × 7.7217) = 0.000159, or about 1.6 basis points. Size matters as much as the spread: at a 2 bp greenium the break-even issue size is 613,304 ÷ (0.0002 × 7.7217) = $397 million, so a $200 million issue with the same fixed costs would lose money on pricing alone. Issuers who still label small bonds are paying for something other than a lower coupon: a wider investor base, a signal of strategy, or eligibility for green mandates.
As an investor, price a green bond off the issuer’s conventional curve: if the greenium is wider than about 5 bps, you are paying for the label, so check that you need it for a mandate. Then read three documents before calling it green: the framework (which projects, judged against which taxonomy or criteria), the external review, and the latest allocation report (how much is spent, how much is refinancing of old assets). As an issuer, label only if the expected greenium times size times the annuity factor exceeds the fixed and annual costs, or if you need access to dedicated green investors. Ignore the pricing test for a debut sovereign or a first-time issuer, where the strategic signal is the point.
Treating “green” as a credit feature. A green bond’s default risk and recovery are the issuer’s; the label changes neither. An investor who accepts a 6 bp greenium on a $50 million holding gives up $50,000,000 × 0.0006 = $30,000 a year, $231,652 in present value over 10 years at 5% (30,000 × 7.7217), for no reduction in credit risk, and a green bond of a weak issuer will fall with that issuer’s other debt. Price the credit first, then decide whether the label is worth paying for.
Are green bonds safer than regular bonds?
No. A green bond ranks equally with the issuer’s other debt of the same seniority, so its default risk is the issuer’s. The only differences are the commitment to spend an amount equal to the proceeds on eligible projects and the reporting that comes with it.
What is a greenium?
It is the lower yield investors accept on a green bond compared with an otherwise identical conventional bond from the same issuer. Measured greeniums are small: about zero in a matched study of US municipal bonds, and 5 to 6 basis points in India’s first sovereign green auction in January 2023.
What is the EU Taxonomy?
It is the EU’s classification of environmentally sustainable activities. An activity qualifies if it contributes substantially to one of six environmental objectives, does no significant harm to the other five and meets minimum safeguards. The European Green Bond Standard requires at least 85% of proceeds to go to such activities.
Who checks how green bond money is spent?
The issuer reports allocation, usually annually, and many hire an external reviewer for a pre-issue opinion and post-issue verification. Under the voluntary ICMA Principles this review is recommended; under the European Green Bond Standard it is required, and the reviewers are supervised by ESMA.
A green bond commits an amount equal to its proceeds to eligible projects and carries exactly the issuer’s credit risk. Taxonomies such as the EU’s define what is green, the European Green Bond Standard requires 85% alignment, and the greenium is small enough that the label pays for itself only on large issues or for strategic reasons.
Six questions on this chapter. Decide on your answer first, then click “Reveal Answer.”
1. A $300 million green bond prices with a 4 basis point greenium. How much interest does the issuer save each year?
- $120,000
- $12,000
- $1,200,000
- $40,000
Reveal Answer
Answer: A. $300,000,000 × 0.0004 = $120,000 a year.
2. How does a green bond’s credit risk compare with the issuer’s conventional bonds of the same seniority?
- It is lower, because green assets secure it
- It is lower, because external reviewers monitor it
- The same, since the whole issuer repays it
- It is higher, because proceeds are restricted
Reveal Answer
Answer: C. The use-of-proceeds commitment does not change the issuer’s ability to pay or holders’ claim; default risk is the issuer’s.
3. Under the European Green Bond Standard, what share of proceeds must go to taxonomy-aligned activities?
- At least 70%
- At least 85%
- At least 100%
- At least 50%
Reveal Answer
Answer: B. Regulation (EU) 2023/2631 requires 85%, with a 15% flexibility pocket, and ESMA-supervised external reviewers.
4. Which set of conditions makes an activity taxonomy-aligned under the EU Taxonomy?
- Low emissions intensity, an SBTi target, assurance
- A green label, an 85% allocation, ESMA registration
- An ICMA framework, a second-party opinion, annual reporting
- Substantial contribution, no significant harm, safeguards
Reveal Answer
Answer: D. The Taxonomy Regulation requires a substantial contribution to one of six objectives under screening criteria, DNSH to the others and minimum safeguards.
5. Worked problem: A green bond raises $800m, of which $650m has been allocated to eligible projects. What share?
Reveal Answer
Answer: 650 ÷ 800 = 81.25%.
6. Worked problem: A greenium of 5 basis points applies to the $800m. What is the annual saving?
Reveal Answer
Answer: 0.0005 × $800m = $0.4m.
- European Commission, EU Taxonomy — Six environmental objectives and alignment conditions
- European Commission, European Green Bond Standard — Regulation (EU) 2023/2631; 85% alignment; applies from December 21, 2024