
3.9 Bank Regulation — and the SVB Case Study
Regulation, through capital, liquidity, deposit insurance and stress tests, exists so that one bank’s failure does not become a systemic crisis. Silicon Valley Bank, now the third-largest US bank failure by assets, died of duration and liquidity risk, not credit risk.
Why it matters: It showed that safe-looking bonds can sink a bank when rates rise fast.
Summary: Regulation (capital, liquidity, deposit insurance, stress tests) exists so that one bank’s failure does not become a systemic crisis. Silicon Valley Bank, now the third-largest US bank failure by assets, died of duration and liquidity risk, not credit risk.
- SVB failed on March 10, 2023; about 94% of its deposits were uninsured and its bonds had a 6.2-year duration.
- The Fed’s target range rose from 0–0.25% to 4.50–4.75% between March 2022 and February 2023, 450 basis points in under a year, which cut the value of long-duration bonds.
- On March 8, 2023, SVB announced it had sold $21 billion in bonds at a $1.8 billion loss and needed to raise $2.25 billion; on March 9 alone it lost over $40 billion in deposits.
- Washington Mutual (2008) and First Republic (May 2023) were the two larger US bank failures.
Because banks are so interconnected, so essential to everyday economic life, and so capable of causing widespread damage when they fail, they are among the most heavily regulated institutions in any economy. Regulation exists to prevent individual bank failures from becoming systemic crises.

| Regulatory Concept | What It Means in Practice |
|---|---|
| Capital Requirements | Banks must hold a minimum amount of their own equity as a buffer against losses. Higher requirements = more resilient bank, but less lending capacity. |
| Liquidity Requirements | Banks must hold sufficient liquid assets (cash and easily-sellable securities) to survive a sudden surge in withdrawal demands — the lesson of bank runs. |
| Deposit Insurance | Governments guarantee ordinary depositors get their money back up to a limit even if their bank fails. FDIC insures up to $250,000 in the US; DICGC covers up to ₹5 lakh in India. |
| Stress Testing | Regulators run hypothetical crisis scenarios on large banks to see if they have enough capital to survive severe economic downturns without needing a bailout. |
| CASS (UK FCA) | Client Asset Sourcebook — UK rules requiring firms to keep client money and assets strictly segregated from the firm’s own money. Holding CASS responsibility is a significant, personally accountable regulatory designation in UK financial operations. |
Bank regulation is like the building code for construction. Most days, buildings stand without incident. But the codes exist so that when an earthquake hits, the buildings are strong enough to protect the people inside. Capital requirements, liquidity rules, and stress tests are the financial equivalent of those structural requirements — they ensure that when economic earthquakes happen, the banking system is built to survive them.
Case Study: Silicon Valley Bank — Liquidity Risk vs Solvency Risk
The collapse of Silicon Valley Bank on March 10, 2023 — the third-largest US bank failure in history by assets, after Washington Mutual (2008) and First Republic (May 2023) — is the most instructive banking case study since 2008, and it illustrates a fundamentally different type of failure: not credit risk (as in 2008) but duration risk and liquidity risk.
The setup: SVB, founded in 1983, primarily served tech startups and venture capital firms. During 2020–2021, when interest rates were near zero and venture capital was flooding into tech companies, SVB received enormous deposits from its clients. With this deposit surge, SVB did what many banks did: it invested heavily in long-duration US Treasury bonds and mortgage-backed securities — safe assets on paper, paying slightly higher yields than short-term instruments.
The problem: When the Fed raised interest rates sharply in 2022 (the target range rose from 0–0.25% to 4.50–4.75% between March 2022 and February 2023, 450 basis points in under a year), those long-duration bonds lost significant market value — because bond prices fall when interest rates rise, and the longer the bond’s duration, the larger the price drop. SVB’s bond portfolio was sitting on large unrealized losses. At the same time, SVB’s tech startup clients were withdrawing deposits faster than before — because venture capital funding was drying up and startups needed to fund their operating costs from their bank balances.
The sequence: On March 8, 2023, SVB announced it had sold $21 billion in bonds at a $1.8 billion loss and needed to raise $2.25 billion in new capital. This announcement — framed as a routine capital raise — instead triggered alarm. Social media and SVB’s tight-knit network of venture capital investors spread the alarm within hours. On March 9 alone SVB lost over $40 billion in deposits, and management expected more than $100 billion of further outflows the next day — a classic bank run, run at the speed of digital transactions (Federal Reserve review, April 2023).
The critical distinction: SVB was arguably solvent — if its bond portfolio had been held to maturity, the losses would not have been realized. But it was illiquid — it could not meet the pace of withdrawal demands without selling bonds at a loss, which made its capital position worse, which triggered more withdrawals in a self-reinforcing spiral. Solvency is a balance sheet concept (assets exceed liabilities). Liquidity is a cash-flow concept (can you meet today’s obligations). A bank can be technically solvent yet fail from illiquidity — which is exactly what happened.
The regulatory gap: A 2018 law (the Economic Growth, Regulatory Relief, and Consumer Protection Act) raised the asset threshold for automatic enhanced prudential standards from $50 billion to $250 billion, and the Fed’s 2019 tailoring rule sorted large banks into categories. SVB, with $209 billion in assets, therefore faced a less stringent set of standards than it would have before 2019, and the Fed’s own review found that heightened supervisory expectations reached it at least three years later than they otherwise would have. Supervisors had in fact planned to downgrade its rating for interest rate risk, but the bank failed first. The two sections that follow show where such risk went instead: into non-bank finance (Section 3.10: Shadow Banking — Finance Outside the Regulated Perimeter) and into funding markets (Section 3.16: The Repo Market — The Financial System’s Overnight Plumbing).
The outcome: The FDIC seized SVB on March 10, 2023. To prevent contagion spreading to other regional banks, the US government announced it would guarantee all SVB deposits — not just the $250K FDIC limit — funded by fees charged to the banking industry rather than by taxpayers directly. Within days, Signature Bank also failed. The episode triggered stress across global banking (Credit Suisse, already under pressure, was forced into a rescue merger with UBS). The SVB collapse demonstrated that in the digital age, a bank run can happen in hours rather than days, compressing the time regulators have to respond.
Two numbers explain the speed. First, about 94% of SVB’s deposits were uninsured at the end of 2022 (Federal Reserve review, April 2023). A startup with $5 million in the bank was covered for $250,000, or 250,000 ÷ 5,000,000 = 5%; the other $4.75 million was at risk if the bank failed, so moving it to a larger bank cost little and waiting could cost almost everything. Insured retail depositors have no reason to run; large uninsured ones have every reason to run first.
Second, duration. SVB’s held-to-maturity bonds had a weighted-average duration of 6.2 years, so each 1-percentage-point rise in yields cut their market value by roughly 6.2%: about $1,000,000,000 × 6.2 × 0.01 = $62 million per $1 billion of bonds, and $186 million for a 3-point rise. Accounting let the bank carry those bonds at cost, but the market value is what a buyer would pay if the bank had to sell them to repay depositors. Once depositors asked for their money back, the hidden loss became real.
Why did Silicon Valley Bank fail?
Of duration and liquidity risk, not credit risk. About 94% of its deposits were uninsured and its bonds had a 6.2-year duration, so rising rates cut their value.
What happened in the days before SVB failed?
On March 8, 2023, SVB announced it had sold $21 billion in bonds at a $1.8 billion loss and needed to raise $2.25 billion. On March 9 alone it lost over $40 billion in deposits, and it failed on March 10.
How fast did the Fed raise rates before SVB failed?
The target range rose from 0–0.25% to 4.50–4.75% between March 2022 and February 2023, 450 basis points in under a year.
Why are banks regulated?
Capital, liquidity rules, deposit insurance and stress tests exist so that one bank’s failure does not become a systemic crisis.
Regulation (capital, liquidity, deposit insurance, stress tests) exists so one bank’s failure does not become a systemic crisis. Silicon Valley Bank, now the third-largest US bank failure by assets, died of duration and liquidity risk: about 94% of its deposits were uninsured, its bonds had a 6.2-year duration, and a run drained over $40 billion in a day, so a bank that was arguably solvent could not pay.
Four questions and two worked problems on this chapter. Decide on your answer first, then click “Reveal Answer.”
1. By total assets at failure, where does Silicon Valley Bank (March 2023) rank among US bank failures?
- Second-largest, behind only Washington Mutual in 2008
- Fourth-largest, behind Washington Mutual and two others
- Third-largest, behind Washington Mutual and First Republic
- Largest, ahead of both Washington Mutual and First Republic
Reveal Answer
Answer: C. FDIC records show Washington Mutual at $307.0 billion, First Republic at $229.1 billion (April 2023 figure) and SVB at $209.0 billion, so SVB is third. Older accounts that call it second predate First Republic’s failure.
2. A start-up keeps $5,000,000 at a bank whose deposit insurance covers $250,000 per depositor. What share of the balance is insured, and why does that speed up a run?
- 95%, so little is at risk and there is no reason to run
- 5%, so the other 95% is at risk and moving first pays
- 25%, so a quarter is at risk and moving costs more than it saves
- 50%, so half is at risk and waiting costs the depositor little
Reveal Answer
Answer: B. $250,000 ÷ $5,000,000 = 5%. With 95% uninsured, a depositor who waits risks a large loss, so large uninsured depositors run first.
3. SVB’s held-to-maturity bonds had a duration of 6.2 years. Using the chapter’s rule, roughly how much value would $2 billion of such bonds lose if yields rose 2 percentage points?
- About $400 million
- About $62 million
- About $124 million
- About $248 million
Reveal Answer
Answer: D. $2,000,000,000 × 6.2 × 0.02 = $248,000,000. The loss was invisible while the bonds were carried at cost, but it became real once depositors demanded cash.
4. Why does the chapter call SVB arguably solvent yet illiquid?
- Its assets were already worth less than its liabilities, and it lacked cash too
- Regulators had ordered it to hold no cash in reserve, so it ran out at once
- Held to maturity its bonds would repay, but sales to meet withdrawals locked in losses
- Its loans had defaulted in large numbers, which caused the outflow of deposits
Reveal Answer
Answer: C. Solvency compares assets with liabilities; liquidity is whether you can pay today. Forced sales of bonds turned unrealized losses into realized ones, which fed the run.
5. Worked problem: A bank holds $100bn of bonds with a duration of 6.2. Rates rise 2 points. What is the approximate loss?
Reveal Answer
Answer: Loss ≈ 6.2 × 2% = 12.4% of $100bn = $12.4bn.
6. Worked problem: Deposits are $170bn and 94% are uninsured. How much is uninsured?
Reveal Answer
Answer: 0.94 × $170bn = $159.8bn that can run without a government guarantee.
3.10 Shadow Banking — Finance Outside the Regulated Perimeter
Shadow banking, which the Financial Stability Board now calls non-bank financial intermediation, is lending and credit activity outside the regulated banking system. It is huge on the broad measure and much smaller on the narrow measure of bank-like, run-prone activity.
Why it matters: It shows where credit risk can build outside the reach of bank regulation.
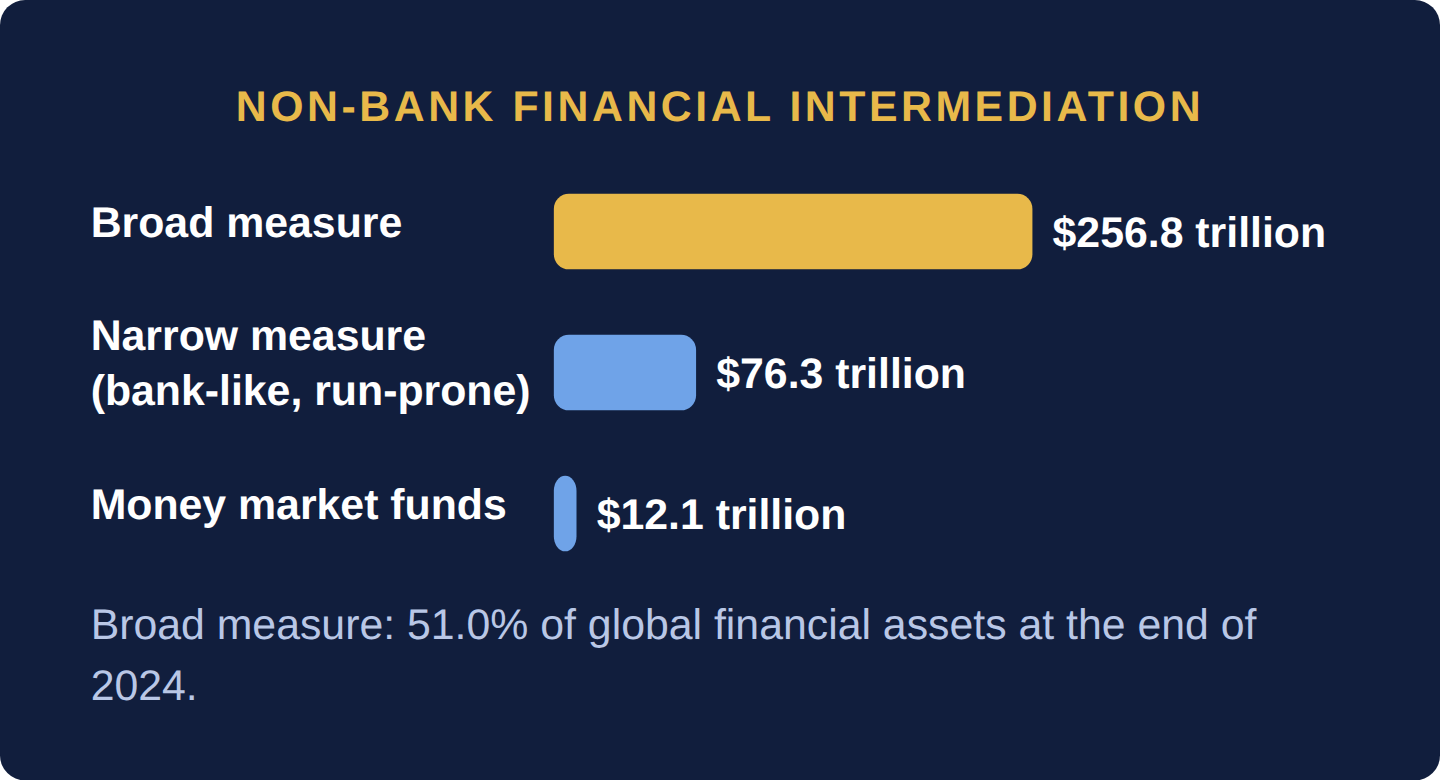
Summary: Shadow banking, which the FSB now calls non-bank financial intermediation, is lending and credit activity outside the regulated banking system. It holds $256.8 trillion on the broad measure but only $76.3 trillion, about 30%, on the narrow measure of bank-like, run-prone activity.
- The broad measure was 51.0% of global financial assets at the end of 2024, after growing 9.4% that year, about double the pace of banks.
- Money market funds alone held $12.1 trillion.
- Private credit is estimated from commercial data at about $1.5–2.0 trillion, although the FSB’s member authorities could identify only about $0.5 trillion in official data.
Shadow banking refers to lending and credit activity that happens outside the traditional regulated banking system — performed by entities that function like banks (connecting savers and borrowers, creating credit) but are not regulated as banks. Shadow banking institutions include hedge funds, money-market funds, private credit funds, mortgage REITs, and finance companies.
Shadow banking was a significant contributor to the 2008 crisis: much of the risky securitization activity happened in the shadow banking system, where leverage could be built without the capital requirements imposed on regulated banks. Since 2008 it has grown rather than shrunk. The Financial Stability Board, which now calls it non-bank financial intermediation (NBFI), publishes two numbers that are often confused. The broad measure counts every financial institution that is not a bank, central bank or public financial institution, pension funds and insurers included: $256.8 trillion at the end of 2024, 51.0% of global financial assets, after growing 9.4% that year, about double the pace of banks. The narrow measure keeps only the activities that look like banking and can suffer bank-like runs: funds that promise easy withdrawal, finance companies and broker-dealers that rely on short-term funding, and securitization vehicles. It stood at $76.3 trillion, 76.3 ÷ 256.8 ≈ 30% of the broad figure. Money market funds alone held $12.1 trillion. Private credit, direct lending to companies by non-bank funds, is estimated from commercial data at about $1.5–2.0 trillion, although the FSB’s member authorities could identify only about $0.5 trillion in official data, a sign of how thin the data are. It grew partly because tighter bank regulation pushed lending outside the regulated perimeter.
Shadow banking is like the informal lending market in a neighborhood where some lenders are registered and supervised by the local authority (regulated banks) while others operate informally, following their own rules (shadow banks). The informal lenders can often move faster and offer more tailored terms — but when things go wrong, there is no supervisor to step in, and the losses can cascade unpredictably into the formal system.
What is shadow banking?
Lending and credit activity outside the regulated banking system, which the FSB now calls non-bank financial intermediation.
How big is shadow banking?
$256.8 trillion on the broad measure, 51.0% of global financial assets at the end of 2024, but only $76.3 trillion, about 30%, on the narrow measure of bank-like, run-prone activity.
How big are money market funds and private credit?
Money market funds alone held $12.1 trillion. Private credit is estimated from commercial data at about $1.5–2.0 trillion, although the FSB’s member authorities could identify only about $0.5 trillion in official data.
How fast is non-bank lending growing?
The broad measure grew 9.4% in 2024, about double the pace of banks.
Shadow banking, which the FSB now calls non-bank financial intermediation, holds $256.8 trillion on the broad measure but only $76.3 trillion (about 30%) on the narrow measure of bank-like, run-prone activity. It grew partly because tighter bank rules pushed lending, including private credit, outside the regulated perimeter, and the data on it are thin.
Four questions and two worked problems on this chapter. Decide on your answer first, then click “Reveal Answer.”
1. The FSB’s broad measure of non-bank financial intermediation was $256.8 trillion at end-2024 and its narrow measure $76.3 trillion. The narrow measure is about what share of the broad one?
- About 15%
- About 75%
- About 50%
- About 30%
Reveal Answer
Answer: D. 76.3 ÷ 256.8 ≈ 0.297, or about 30%. The narrow measure keeps only the activities that look like banking and can suffer runs.
2. Which of these belongs in the FSB’s narrow measure of non-bank finance?
- A pension fund paying retirees a fixed monthly income for life
- A money market fund that lets investors withdraw on demand
- A central bank holding a large stock of government bonds
- An insurer collecting annual premiums on its home policies
Reveal Answer
Answer: B. The narrow measure targets bank-like run risk, such as funds promising easy withdrawal. Pension funds and insurers appear only in the broad measure, and central banks are excluded from both.
3. According to the chapter, why did private credit grow after 2008?
- Tighter bank rules pushed some lending outside the regulated perimeter
- Deposit insurance was withdrawn from ordinary bank savings accounts
- Governments required companies to borrow from funds instead of banks
- Interest rates rose so far that banks stopped making any loans
Reveal Answer
Answer: A. Rules on capital and liquidity made some bank lending costlier, and non-bank funds that face lighter rules filled part of the gap.
4. The FSB found only about $0.5 trillion of private credit in official data, while commercial estimates are $1.5–2.0 trillion. What does the gap mainly show?
- Official data count only loans made by banks
- Private credit is hard to identify in official statistics
- Private credit shrank sharply during 2024
- Commercial data providers overstate the market by about four times
Reveal Answer
Answer: B. The FSB itself says there was no standard definition of private credit in regulatory reports, so measurement is thin and estimates differ widely.
5. Worked problem: Non-bank financial intermediation holds $256.8tn, 51.0% of global financial assets. What are total global financial assets?
Reveal Answer
Answer: $256.8tn ÷ 0.51 = $503.5tn.
6. Worked problem: It grew 9.4% in 2024. What was its size at the end of 2023?
Reveal Answer
Answer: $256.8tn ÷ 1.094 = $234.7tn.
3.11 Derivatives — Contracts Built on Top of Other Things
A derivative is a contract whose value depends on something else, used to hedge a risk or to speculate with leverage. Headline sizes count the notional amount, but the cost of replacing contracts is only a small fraction of it.
Why it matters: It keeps the huge headline figures from sounding more frightening than they are.
Summary: A derivative is a contract whose value depends on something else, used to hedge a risk or to speculate with leverage. Headline sizes count the notional amount, but the cost of replacing contracts is only a small fraction of it.
- A company with a $100 million floating-rate loan that pays 4.00% fixed and receives SOFR (3.87% on October 1, 2026) nets $130,000 for the year; the $100 million itself never changes hands.
- Over-the-counter derivatives had a notional amount outstanding of $844.6 trillion at the end of 2025, 79% of it interest-rate contracts ($669.5 trillion).
- Their gross market value, the cost of replacing every contract at market prices, was $22.8 trillion, about 2.7% of notional.
A derivative is a contract whose value depends on something else: a price, an interest rate, a currency. Companies use derivatives to remove a risk they do not want; speculators use them to take on more risk with less cash. The headline sizes are enormous because they count the amount the contract refers to, not the money that actually changes hands.
A derivative is a financial contract whose value is derived from — based on — something else: an underlying asset like a stock, a commodity, an interest rate, or a currency. Derivatives are used both to manage risk (hedging) and to speculate on price movements with amplified exposure (leverage). They are not inherently dangerous — the problem arises when they are used for excessive speculation without adequate capital to cover potential losses.
| Type | How It Works | Common Use |
|---|---|---|
| Futures | A binding contract to buy or sell a specific asset at a specific price on a specific future date | Commodity producers lock in prices; currency traders hedge FX exposure; investors hedge portfolio risk |
| Options | The right — but not the obligation — to buy (call) or sell (put) at a set price by a certain date. You pay a premium for this right. | Portfolio insurance; speculative bets on direction with limited downside (maximum loss = the premium paid) |
| Swaps | Two parties agree to exchange a series of future cash flows — most commonly a fixed interest rate for a floating rate (interest rate swap) | Companies with floating-rate debt convert to fixed-rate certainty; banks manage their interest rate exposure |
| Forward Contracts | Like futures but privately negotiated (over-the-counter) rather than exchange-traded; fully customizable | Currency forwards for international businesses locking in FX rates for future transactions |
| Credit Default Swaps (CDS) | Insurance-like contract paying out if a specific borrower defaults on their debt | Notorious role in 2008 crisis — AIG had sold vast amounts of CDS protection it could not honor |

The gap between the two sizes is easy to see in an interest rate swap. Suppose a company with a $100 million floating-rate loan agrees to pay a bank a fixed 4.00% a year and receive SOFR (3.87% on October 1, 2026) on a notional value of $100 million. The $100 million itself never changes hands; only the difference in interest does. At these rates the company pays a net $100,000,000 × (4.00% − 3.87%) = $130,000 for the year, and in exchange its loan cost no longer moves with SOFR. The same arithmetic, summed across the world, gives the headline figures: over-the-counter derivatives had a notional amount outstanding of $844.6 trillion at the end of 2025, 79% of it interest-rate contracts ($669.5 trillion), but their gross market value, the cost of replacing every contract at market prices, was $22.8 trillion, 22.8 ÷ 844.6 ≈ 2.7% of notional. The risk lies in that smaller number and in whether each counterparty can pay it.
A futures contract is like pre-ordering a product at today’s price for delivery in three months — you are locked in regardless of what the price does. An option is like paying a small fee to reserve the right to buy at today’s price without being obligated to — useful if you think the price might rise but are not certain. A swap is like two people agreeing to trade their household utility contracts: one prefers the certainty of fixed bills, the other is comfortable with variable ones — they swap to get what each prefers.
What is a derivative?
A contract whose value depends on something else, used to hedge a risk or to speculate with leverage.
How does an interest rate swap work?
A company with a $100 million floating-rate loan that pays 4.00% fixed and receives SOFR (3.87% on October 1, 2026) nets $130,000 for the year. The $100 million itself never changes hands.
How big is the derivatives market?
Over-the-counter derivatives had a notional amount outstanding of $844.6 trillion at the end of 2025, 79% of it interest-rate contracts ($669.5 trillion).
Is the notional amount the same as the risk?
No. The gross market value, the cost of replacing every contract at market prices, was $22.8 trillion, about 2.7% of notional.
A derivative is a contract whose value depends on something else, used to hedge risk or to speculate with leverage. Headline sizes count the notional amount ($844.6 trillion at end-2025), but the cost of replacing contracts was only $22.8 trillion (about 2.7%), and the risk lies in that number and in the counterparties’ ability to pay.
Four questions and two worked problems on this chapter. Decide on your answer first, then click “Reveal Answer.”
1. A company pays a fixed 4.00% and receives SOFR (3.87%) on a $50 million notional swap for one year. What is its net payment?
- $6,500
- $1,935,000
- $65,000
- $2,000,000
Reveal Answer
Answer: C. $50,000,000 × (4.00% − 3.87%) = $65,000. Only the interest difference changes hands, not the $50 million.
2. At the end of 2025, over-the-counter derivatives had a notional amount of $844.6 trillion and a gross market value of $22.8 trillion. Gross market value was about what share of notional?
- About 2.7%
- About 27%
- About 37%
- About 0.27%
Reveal Answer
Answer: A. 22.8 ÷ 844.6 ≈ 0.027, or 2.7%. Notional counts the amounts the contracts refer to; gross market value is the cost of replacing them.
3. An investor buys a call option and the price of the underlying asset collapses. What is the most the option buyer can lose?
- The full notional value of the contract
- The difference between the strike and zero, plus the premium
- Twice the premium paid
- The premium paid for the option
Reveal Answer
Answer: D. An option gives a right, not an obligation, so the buyer can let it expire and lose only the premium.
4. Why do headline derivatives figures look so large compared with the money at risk?
- They are quoted in a currency that has lost most of its value
- They count the amount contracts refer to, not the cash exchanged
- They include the full value of every bank deposit worldwide
- They add every contract’s profit and every contract’s loss twice
Reveal Answer
Answer: B. Notional is the reference amount. Real exposure is the premium, the margin posted, or the replacement cost of a contract.
5. Worked problem: A firm has a $250m floating-rate loan. It pays 4.25% fixed on a swap and receives SOFR of 3.90%. What is the net swap payment for the year?
Reveal Answer
Answer: Net = $250m × (4.25% − 3.90%) = $875,000 paid.
6. Worked problem: The swap notional is $1tn but the net exposure is 2%. What is the real exposure?
Reveal Answer
Answer: 2% × $1tn = $20bn: headline notional overstates the risk.
- FDIC failures data
- FDIC, Silicon Valley Bank closure
- FDIC, First Republic Bank closure
- Federal Reserve, Review of the Federal Reserve’s Supervision and Regulation of Silicon Valley Bank (April 28, 2023)
- Financial Stability Board, Global Monitoring Report on Non-Bank Financial Intermediation 2025 (December 2025)
- BIS OTC derivatives statistics
- Federal Reserve Bank of New York