
5.1 Private vs Publicly Listed Companies
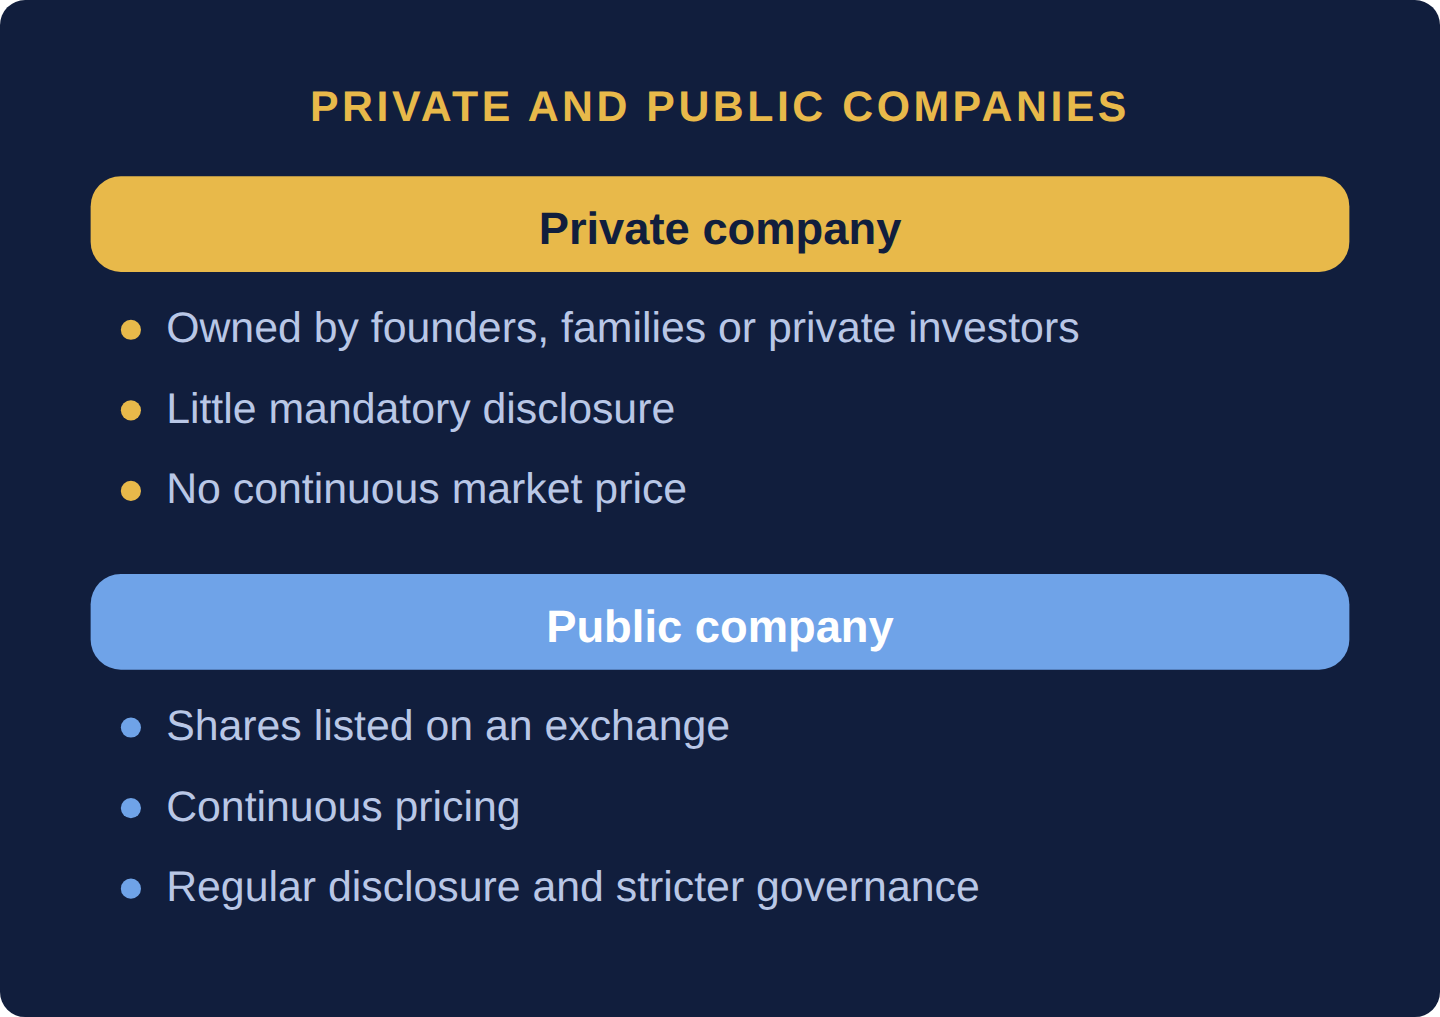
Every business starts private, owned by founders, families or private investors, with little mandatory disclosure. An IPO lists its shares on an exchange and brings continuous pricing, regular disclosure and stricter governance. Many large companies stay private by choice.
Why it matters: Whether a company is listed changes who can own it and how much the public can see.
Summary: Every business starts private, owned by founders, families or private investors, with little mandatory disclosure; an IPO lists its shares on an exchange and brings continuous pricing, regular disclosure and stricter governance. Many large companies stay private by choice.
- IKEA generates over $40 billion in annual revenues but has never listed, and many significant Indian family-run conglomerates operate without stock market listings.
- US tech companies now stay private for over ten years on average before IPO, against roughly four years in the 1990s, because private funding from venture capital and growth equity has become so abundant.
- A public company is like a restaurant open to everyone: shareholders get an annual report, can vote at the AGM, and their investment rises or falls with the company’s fortunes.
Every business starts as a private company — owned by its founders, family members, or private investors, with no public trading of its shares. A public company (or publicly listed company) has gone through the IPO process and now has shares trading on a stock exchange, owned by potentially thousands or millions of investors. The IPO is the legal and operational event that marks the transition from private to public — and it fundamentally changes almost everything about how a company operates.
| Dimension | Private Company | Public Company |
|---|---|---|
| Ownership | Founders, family, private equity, venture capital, or a small group of investors | Thousands to millions of shareholders whose shares trade continuously on the exchange |
| Share trading | No — shares can only be sold through private negotiations | Yes — shares trade on the exchange during market hours, with continuous price discovery |
| Capital raising | Limited to private rounds: venture capital, private equity, bank loans | Can raise capital from the public through share issuance or bond markets at scale |
| Disclosure | Minimal — private companies have limited mandatory public disclosure requirements | Extensive — quarterly results, annual reports, and material events must all be publicly disclosed |
| Valuation | Private, negotiated, and often uncertain — determined in funding rounds | Continuous and real-time — market capitalization = share price × shares outstanding |
| Governance | More flexible — fewer mandatory governance requirements | Strict — board composition, audit committees, independent directors, and more are all regulated |
| Examples | IKEA, Cargill, Koch Industries, Ola Cabs (ANI Technologies), Byju’s, Mars | Apple, TCS, HDFC Bank, Reliance Industries, Infosys, Bharti Airtel |
Many companies remain private by choice for long periods — or indefinitely. IKEA generates over $40 billion in annual revenues but has never listed. In India, many significant family-run conglomerates operate major businesses without stock market listings. Increasingly, the decision to “go public” is being delayed — US tech companies now stay private for over ten years on average before IPO, compared to roughly four years in the 1990s, primarily because private funding from venture capital and growth equity has become so abundant that the capital-raising rationale for an IPO is less urgent.
A private company is like a restaurant that only admits people personally invited by the owner. A public company is like a restaurant open to everyone — any member of the public can buy a meal (a share) at the posted price. Once you are a customer (shareholder), you get a menu (annual report), can vote on major decisions (AGM), and your investment rises or falls with the restaurant’s fortunes.
What is the difference between a private and a public company?
A private company is owned by founders, families or private investors, with little mandatory disclosure. A public company has listed its shares on an exchange, which brings continuous pricing, regular disclosure and stricter governance.
Why do some large companies stay private?
By choice. IKEA generates over $40 billion in annual revenues but has never listed, and many significant Indian family-run conglomerates operate without stock market listings.
How long do tech companies stay private before an IPO?
US tech companies now stay private for over ten years on average, against roughly four years in the 1990s, because private funding from venture capital and growth equity has become so abundant.
Every business starts private, owned by founders, families or private investors, with little mandatory disclosure; an IPO lists its shares on an exchange and brings continuous pricing, quarterly and annual disclosure and stricter governance. Many large companies, such as IKEA, stay private by choice, and abundant private funding has made US tech companies wait longer before listing.
Four questions and two worked problems on this chapter. Decide on your answer first, then click “Reveal Answer.”
1. Which event marks a company’s move from private to public ownership?
- An IPO that lists its shares on a stock exchange
- Its first set of audited annual accounts
- A first venture capital round from outside investors
- A board vote to add independent directors
Reveal Answer
Answer: A. The IPO is the legal and operational event that turns a private company into a listed one, with shares trading continuously on an exchange.
2. Which obligation applies to a listed company but not to a typical private one?
- Raising money from banks through loans
- Publishing quarterly results and material events
- Being owned partly by private equity investors
- Having its accounts prepared by a finance team
Reveal Answer
Answer: B. Public companies must disclose quarterly results, annual reports and material events; private companies have limited mandatory disclosure.
3. According to the chapter, why are US tech companies waiting longer before going public?
- Private firms face heavier disclosure, so they wait
- Regulators cap the number of tech listings each year
- Plentiful private funding makes an IPO less urgent
- Exchanges now demand ten years of profits first
Reveal Answer
Answer: C. Venture capital and growth equity have become so abundant that the capital-raising reason for an IPO is less pressing.
4. The chapter cites IKEA as an example of what?
- A family firm that listed to fund its expansion
- A public company with listings in two countries
- A company that delisted after an accounting fraud
- A very large business that has never listed
Reveal Answer
Answer: D. IKEA has large annual revenues but has stayed private; many big companies remain private by choice.
5. Worked problem: A founder owns 60 million of 100 million shares. The IPO sells 20 million new shares. What is the founder’s stake afterward?
Reveal Answer
Answer: 60 ÷ 120 = 50%.
6. Worked problem: The IPO price is $25. What is the market capitalization and the founder’s stake worth?
Reveal Answer
Answer: Market cap = 120m × $25 = $3.0bn. Stake = 60m × $25 = $1.5bn.
5.2 Market Capitalization — The Market's Continuous Verdict
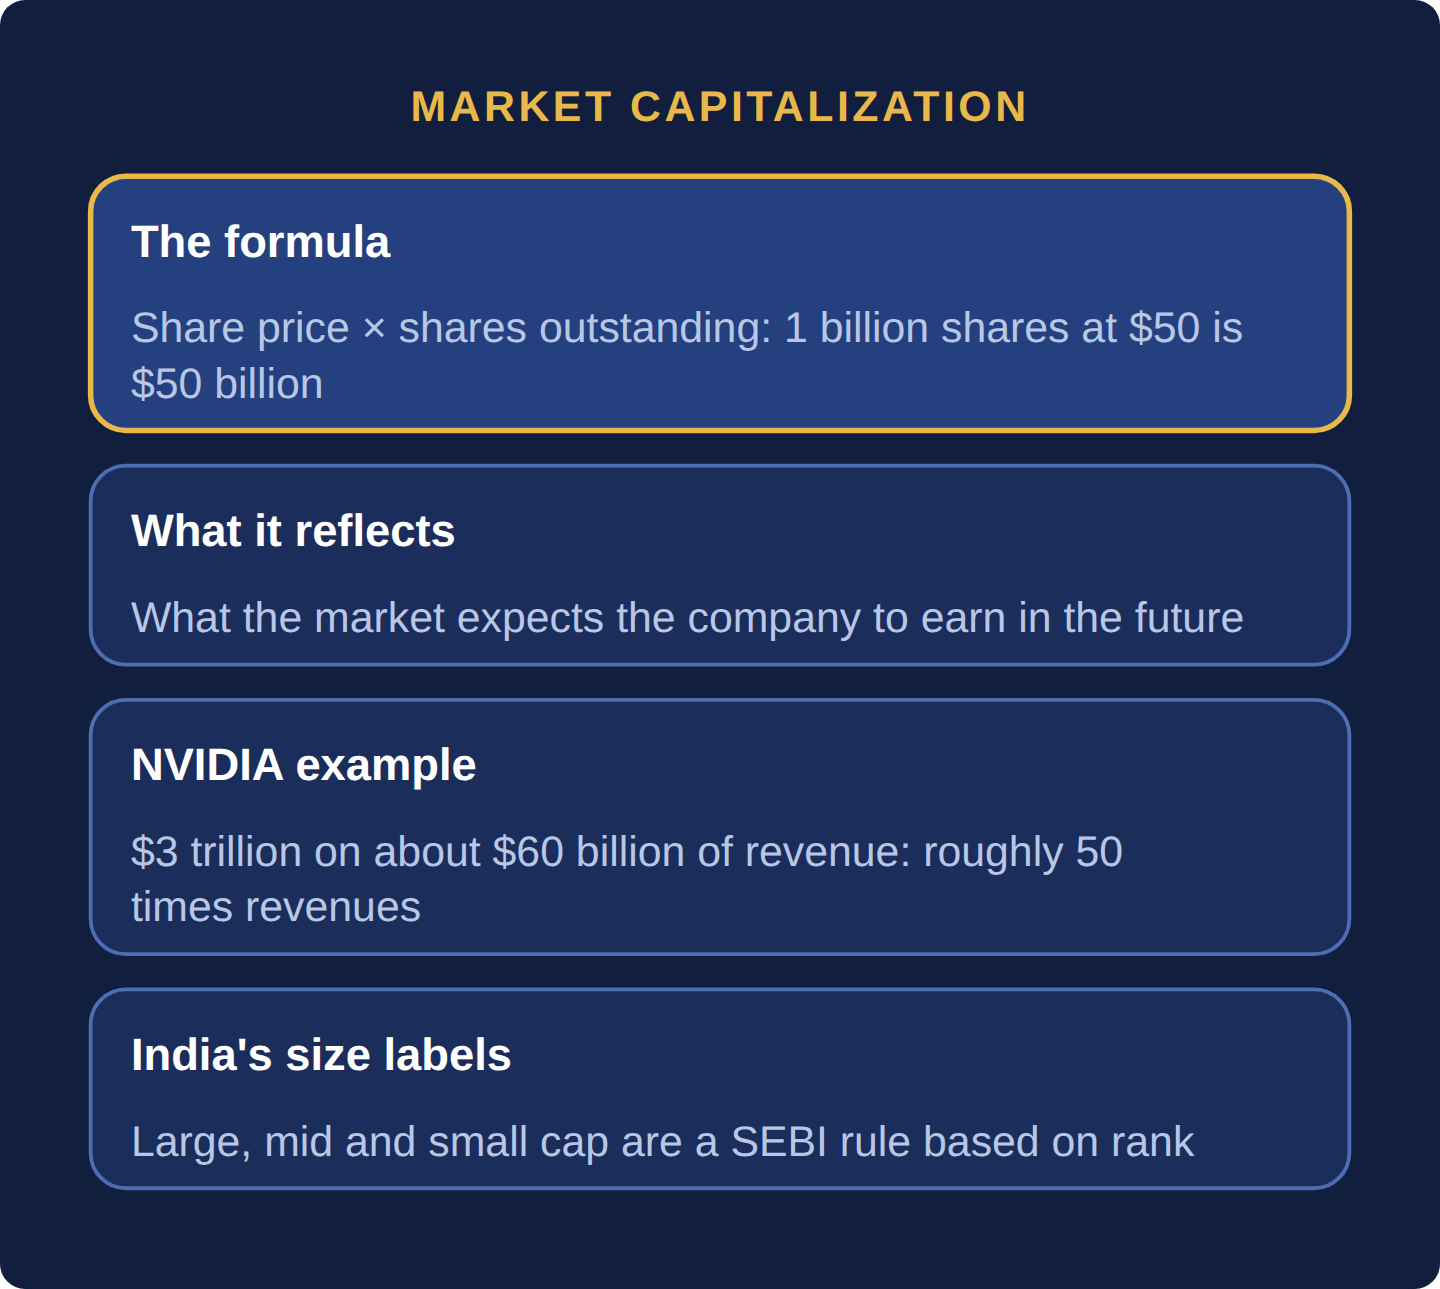
Market capitalization is the share price times the number of shares outstanding. It reflects what the market expects a company to earn in the future, not its current revenue or profit. In India the large-, mid- and small-cap labels are a SEBI rule based on rank.
Why it matters: It is the standard way to compare how big the market thinks companies are.
Summary: Market capitalization is share price × shares outstanding, and it reflects what the market expects a company to earn in the future, not its current revenue or profit. In India the large-, mid- and small-cap labels are a SEBI rule based on rank.
- A company with 1 billion shares at $50 has a market cap of $50 billion.
- NVIDIA‘s market cap reached $3 trillion when its annual revenues were about $60 billion, implying investors were paying roughly 50 times revenues.
- In India the top 100 companies by full market cap are large caps, 101–250 are mid caps and 251 onward are small caps, on a list AMFI refreshes every six months.
Market capitalization (market cap) is the total market value of a company’s outstanding shares — calculated by multiplying the current share price by the total number of shares outstanding. It is the most immediate and continuously updated measure of what the market collectively believes a company is worth, and it changes every second during trading hours.
Formula: Market Cap = Current Share Price × Total Shares Outstanding. If a company has 1 billion shares outstanding and its share price is $50, its market capitalization is 1 billion × $50 = $50 billion. This number updates in real time as the price moves.
| Category | India (SEBI rule, by rank) | US (market convention) | Characteristics |
|---|---|---|---|
| Large Cap | 1st–100th company by full market cap (100th: ≈ ₹1,05,174 crore) | Above $10 billion | Established, stable, lower risk; make up most major indices; institutional investor focus |
| Mid Cap | 101st–250th company (250th: ≈ ₹34,758 crore) | $2–10 billion | Growth-oriented; more volatile than large cap but potentially higher returns |
| Small Cap | 251st company onward | $300M–$2 billion | Higher growth potential, higher risk, less liquidity, harder to research |
| Micro Cap | No official category; informal label for the smallest small caps | Below $300 million | Highest risk; often limited analyst coverage; illiquid; can generate outsized returns or losses |
As of early 2026 (a snapshot; rankings and values move daily), the world’s most valuable companies by market cap include NVIDIA (~$4.5 trillion, having briefly crossed $5 trillion in late 2025 — the first company ever to reach either milestone), Apple and Microsoft (each around $4 trillion), Alphabet/Google (~$3.5 trillion), and Amazon (~$2.5 trillion). India’s five largest in AMFI’s list for the second half of 2025 were Reliance Industries, HDFC Bank, Bharti Airtel, TCS and ICICI Bank. In India, size bands are ranks rather than fixed rupee amounts, so the cutoff moves with the market (the India Lens at the end of Part 5: Companies & Financial Metrics works an example).
Market cap is not the same as a company’s revenues, its profits, or its book value. A company with $1 billion in revenues might be worth $20 billion in market cap if investors believe it will grow dramatically over the next decade. This is common in technology — NVIDIA’s market cap reached $3 trillion at a point when its annual revenues were approximately $60 billion, implying investors were paying roughly 50× revenues for the business. Understanding the relationship between market cap and actual financial performance — and the assumptions embedded in high valuation multiples — is fundamental to any role that involves equity analysis, client conversations, or portfolio-level risk.
What is market capitalization?
Share price times shares outstanding. A company with 1 billion shares at $50 has a market cap of $50 billion.
Does market capitalization measure a company’s current size?
No. It reflects what the market expects the company to earn in the future. NVIDIA’s market cap reached $3 trillion when its annual revenues were about $60 billion, implying investors were paying roughly 50 times revenues.
What are large-cap, mid-cap and small-cap stocks in India?
Labels set by a SEBI rule based on a company’s rank by market capitalization.
Market capitalization is share price × shares outstanding ($50 × 1 billion shares = $50 billion) and reflects what the market expects a company to earn in the future, not its current revenue or profit. In the US, cap bands are a loose convention; in India they are a SEBI rule based on rank: the top 100 companies by full market cap are large caps, 101–250 mid caps and 251 onward small caps, on a list AMFI refreshes every six months.
Four questions and two worked problems on this chapter. Decide on your answer first, then click “Reveal Answer.”
1. A company has 400 million shares outstanding trading at $75 each. What is its market capitalization?
- $3 billion
- $30 billion
- $300 billion
- $30 million
Reveal Answer
Answer: B. Market cap = share price × shares outstanding = $75 × 400,000,000 = $30,000,000,000.
2. Under SEBI’s rule, an Indian listed company ranked 180th by full market capitalization is classed as:
- Large cap
- Micro cap
- Mid cap
- Small cap
Reveal Answer
Answer: C. Large caps are ranks 1–100, mid caps 101–250 and small caps 251 onward; micro cap is not an official category.
3. Why does the rupee value needed to count as a large cap in India change from list to list?
- The category is a rank, so the line is set by the 100th company
- SEBI resets a fixed rupee threshold in each Union Budget
- AMFI sets it as a fixed share of India’s nominal GDP
- The threshold is raised every year in line with CPI inflation
Reveal Answer
Answer: A. Because large caps are simply the top 100 by average full market cap, the cutoff rises and falls with the market.
4. NVIDIA’s market cap reached about $3 trillion when its annual revenue was about $60 billion. Roughly what multiple of revenue were investors paying?
- 500×
- 50×
- 5×
- 20×
Reveal Answer
Answer: B. $3,000 billion ÷ $60 billion = 50, so investors paid about 50 times annual revenue, a bet on much larger future sales.
5. Worked problem: A company has 2.5 billion shares trading at $48. What is its market capitalization?
Reveal Answer
Answer: 2.5bn × $48 = $120 billion.
6. Worked problem: A company is worth $60bn with 1.2bn shares outstanding. What is the price per share?
Reveal Answer
Answer: $60bn ÷ 1.2bn = $50.00.
5.3 Key Financial Metrics — Reading the Scoreboard
Revenue less cost of goods sold, operating expenses, depreciation, interest and tax leads down to net profit. Valuation ratios such as P/E, EV/EBITDA, P/B and ROE turn those numbers into a price, and cash flow tests whether the profit is real.
Why it matters: These few lines of arithmetic are how every listed company gets compared.
Summary: Revenue less cost of goods sold, operating expenses, depreciation, interest and tax leads down to net profit, and valuation ratios such as P/E, EV/EBITDA, P/B and ROE turn those numbers into a price. Cash flow, especially free cash flow, tests whether profit is real.
- In the worked example the company reports revenue of $2,000 million and net profit of $187.5 million, with 100 million shares at $30, net debt of $600 million and free cash flow of $170 million.
- The example gives a 16× P/E, a 9× EV/EBITDA and free cash flow of about 91% of net profit, so the profit is largely turning into cash.
- Buying back 10 million shares at $30 leaves profit unchanged but lifts EPS to $2.083, up 11.1%.
- Each ratio has blind spots: losses, banks, one-off gains, buybacks, capital-hungry firms and closely held shares.
When a public company reports its financial results — quarterly or annually — it produces a set of numbers that analysts, investors, and the media dissect intensely. These metrics form a hierarchy: they describe the same business from different angles, at different levels of detail, and with different implications for shareholders and creditors. Understanding what each number means and how they relate to one another is foundational for anyone in finance.

The Income Statement — Key Metrics Explained
| Metric | Definition | What It Tells You |
|---|---|---|
| Revenue (Turnover) | Total money earned from selling goods and services before any costs are deducted | How large the business is; its top-line growth rate — the first thing every analyst checks |
| Cost of Goods Sold (COGS) | Direct costs of producing the goods or services sold — materials, direct labor, manufacturing | How efficiently the company produces its core product or service |
| Gross Profit | Revenue minus COGS | How much is left after direct production costs — before overhead, marketing, admin, and taxes |
| Gross Margin (%) | Gross Profit ÷ Revenue × 100 | The percentage of revenue retained after direct costs; varies enormously by industry — software companies often exceed 70%, retailers often fall below 30% |
| EBITDA | Earnings Before Interest, Taxes, Depreciation, and Amortization | A rough proxy for operating cash generation; standard for cross-company comparisons and M&A valuation multiples |
| EBIT (Operating Profit) | EBITDA minus depreciation and amortization | The profit from operations before financing costs and tax — what the business earns regardless of how it is financed |
| Net Profit (PAT) | The bottom line — profit after all costs including interest and tax have been paid | What actually accrues to shareholders; the most scrutinized single number in a quarterly result |
| Net Profit Margin (%) | Net Profit ÷ Revenue × 100 | What percentage of revenue becomes profit for shareholders; a key efficiency and competitive strength indicator |
EBITDA — The Most Used and Most Debated Metric in Finance
EBITDA is used everywhere in finance — in company valuations, lending decisions, M&A negotiations, and analyst reports — yet it is also widely misused and misunderstood. What EBITDA adds back relative to Net Profit: Interest (because a company’s debt structure is often a financing choice, not a reflection of operating performance), Tax (because tax rates vary by country and are not a measure of business quality), Depreciation (the accounting allocation of the cost of tangible assets like machinery over their useful lives), and Amortization (the accounting allocation of intangible assets like software or patents).
The purpose is to produce a number approximating the cash generating ability of the business’s core operations, stripped of financing choices and accounting conventions — making it useful for comparing companies with different levels of debt, different tax situations, or different asset lives.
EBITDA is like measuring how powerful a car’s engine is on a test bench, in controlled conditions — without the weight of the car body, without fuel taxes, and without accounting for the car’s depreciation in value. You get a cleaner read on the raw engine performance. But you should never forget that in real life, the car has a body, pays fuel tax, and depreciates. Critics — including Warren Buffett — point out that depreciation represents a real, recurring cost (machinery wears out and must eventually be replaced), not a figment of accounting imagination that can simply be ignored.
Valuation Ratios — How Investors Price Companies
| Ratio | Formula | What It Tells You |
|---|---|---|
| P/E (Price to Earnings) | Share Price ÷ Earnings Per Share (EPS) | How many rupees/dollars investors pay per unit of current earnings. High P/E = high growth expectations; Low P/E = value or slow growth. The most commonly cited valuation metric. |
| EPS (Earnings Per Share) | Net Profit ÷ Shares Outstanding | How much profit per share — the building block of P/E. Diluted EPS accounts for options and convertibles; always prefer diluted. |
| EV/EBITDA | Enterprise Value ÷ EBITDA | Enterprise Value = Market Cap + Net Debt. EV/EBITDA compares total business value (including debt) to operating profit — the standard M&A and cross-company valuation multiple because it is capital-structure neutral. |
| P/B (Price to Book) | Share Price ÷ Book Value Per Share | How much investors pay relative to accounting net asset value. P/B > 1 means the market values the business above its book value (accounting net assets) — common for quality businesses with strong intangibles or brand value. |
| P/S (Price to Sales) | Market Cap ÷ Annual Revenue | Useful for pre-profit companies (early-stage tech, growth startups) where there are no earnings to use in P/E. Tells you how much investors pay per unit of revenue. |
| ROE (Return on Equity) | Net Profit ÷ Shareholders’ Equity × 100 | How efficiently management uses shareholder capital to generate profit. Warren Buffett considers sustained high ROE one of the most important indicators of business quality. Industry context matters greatly. |
| ROA (Return on Assets) | Net Profit ÷ Total Assets × 100 | How efficiently the company uses its entire asset base to generate profit. Particularly useful for comparing capital-intensive businesses (banks, manufacturers, utilities). |
| Dividend Yield | Annual Dividend Per Share ÷ Share Price × 100 | Income return on the investment in the stock. Important for income-seeking investors; high yield can signal either attractive income or a stock price that has fallen due to business concerns. |
Each ratio above carries a hidden assumption. When the assumption fails, the ratio misleads.
| Situation | What changes | Why |
|---|---|---|
| The company makes a loss | P/E has no meaning; analysts use P/S or EV/Sales | With negative EPS the ratio turns negative, and a “P/E of −40” says nothing about price |
| Valuing a bank | EV/EBITDA is dropped; P/B and ROE take over | For a bank, borrowed money (deposits) is the raw material of the business, not a financing choice, so “net debt” cannot be separated out |
| A large one-off gain | Net profit jumps and P/E looks cheap for a year | Selling a division or revaluing an asset is not repeatable; analysts compare operating profit (EBIT) instead |
| Heavy buybacks | EPS grows faster than profit | The same profit is divided by fewer shares; the worked example below shows an 11.1% EPS rise with zero profit growth |
| Capital-hungry businesses | EBITDA flatters; EBIT and free cash flow matter more | Airlines, telecoms and steelmakers must keep replacing equipment, so depreciation is a real recurring cost |
| A founder or parent owns most shares | Total market cap overstates what investors can buy | Index providers weight stocks by free-float market cap, counting only shares available to trade (the Nifty 50 is built this way) |
Cash Flow — Why Profit and Cash Are Not the Same Thing
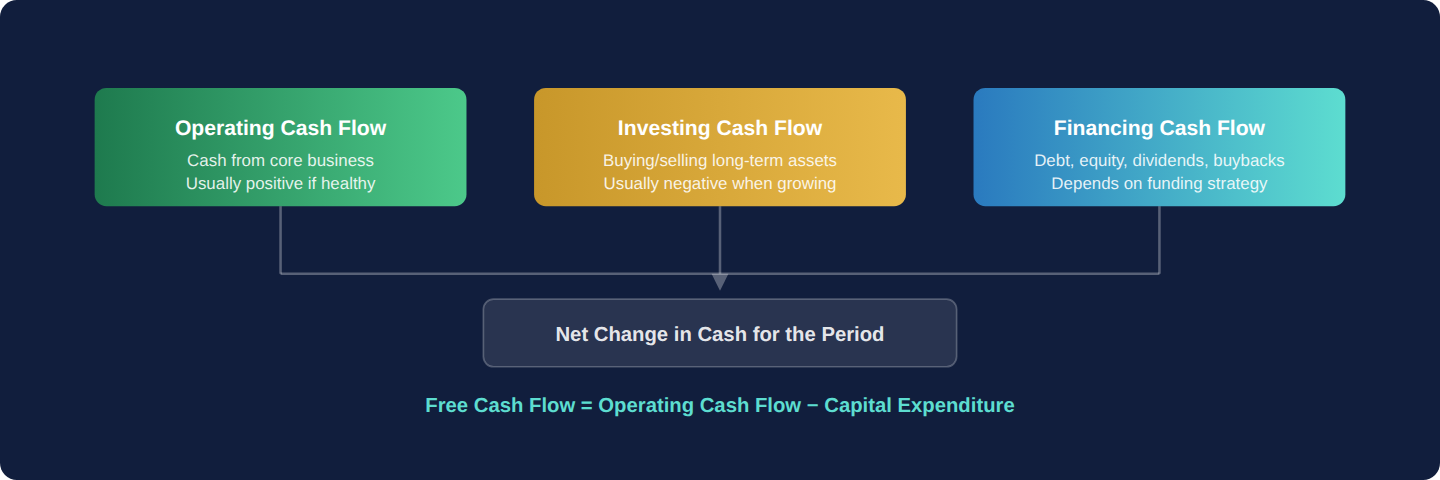
Perhaps the most important distinction in corporate finance that non-specialists miss: a company can be profitable on paper while running out of cash, and a company can have negative net income while generating strong cash flows. This is because accounting profit includes non-cash items (depreciation, amortization) and timing differences (revenue recognized before cash is received; expenses accrued before cash is paid).
| Cash Flow Type | What It Measures |
|---|---|
| Operating Cash Flow (OCF) | Cash generated from the company’s core business operations — the most important measure of day-to-day business health. A business can report a net profit while having negative OCF if customers are slow to pay or inventory is building up. |
| Investing Cash Flow | Cash spent on (or received from) buying or selling long-term assets — factories, equipment, technology infrastructure, acquisitions. Usually negative for growing businesses investing in their future. |
| Financing Cash Flow | Cash flows from raising debt or equity, repaying debt, paying dividends, or buying back shares. Links the income statement and balance sheet to decisions about how the business is funded. |
| Free Cash Flow (FCF) | Operating Cash Flow minus Capital Expenditure — the cash truly available to return to shareholders or invest in acquisitions after maintaining and growing the business. Many analysts consider FCF more reliable than net profit as a measure of business quality. |
Amazon famously reported near-zero or negative net profits for years while building massive free cash flow potential and dominating its markets. Investors who understood cash flow and the difference between accounting profit and economic value bought the stock; those who only looked at net income were confused or scared off. Understanding the relationship between profit, cash generation, and long-term value is one of the most practically important skills in all of finance — whether you are an analyst, in operations, in client services, or in risk management.
Take an illustrative US manufacturer, Harbor Tools Inc. It reports revenue of $2,000 million, cost of goods sold of $1,200 million, operating expenses of $400 million, depreciation and amortization of $100 million, interest of $50 million and a 25% tax rate. It has 100 million shares trading at $30, net debt of $600 million, shareholders’ equity of $1,250 million, operating cash flow of $320 million and capital expenditure of $150 million.
| Metric | Formula with Harbor’s numbers | Result |
|---|---|---|
| Gross profit | $2,000m − $1,200m | $800m (40% margin) |
| EBITDA | $800m − $400m | $400m (20% margin) |
| EBIT | $400m − $100m | $300m (15% margin) |
| Net profit | ($300m − $50m) × (1 − 0.25) | $187.5m (9.4% margin) |
| EPS | $187.5m ÷ 100m shares | $1.875 |
| Market cap | $30 × 100m shares | $3,000m |
| P/E | $30 ÷ $1.875 | 16.0× |
| Enterprise value | $3,000m + $600m | $3,600m |
| EV/EBITDA | $3,600m ÷ $400m | 9.0× |
| ROE | $187.5m ÷ $1,250m | 15% |
| Free cash flow | $320m − $150m | $170m (5.7% of market cap) |
Read the results together, not one at a time. Free cash flow of $170 million is about 91% of net profit ($170m ÷ $187.5m), so the profit is largely turning into cash. Now suppose Harbor spends $300 million of cash it already holds buying back 10 million shares at $30 (ignoring the interest that cash would have earned). Profit is unchanged, but EPS rises to $187.5m ÷ 90m = $2.083, up 11.1%. That is why analysts check whether EPS growth comes from the business or from a shrinking share count.
How do you get from revenue to net profit?
Revenue less cost of goods sold, operating expenses, depreciation, interest and tax leaves net profit.
What are the main valuation ratios?
P/E, EV/EBITDA, P/B and ROE turn financial statement numbers into a price.
What does the worked example show?
A company with revenue of $2,000 million, net profit of $187.5 million, 100 million shares at $30, net debt of $600 million and free cash flow of $170 million has a 16× P/E and a 9× EV/EBITDA.
Why does free cash flow matter?
It tests whether profit is real. In the example free cash flow is about 91% of net profit, so the profit is largely turning into cash.
Revenue less cost of goods sold, operating expenses, depreciation, interest and tax leads down to net profit, and valuation ratios such as P/E, EV/EBITDA, P/B and ROE turn those numbers into a price. Each ratio has blind spots (losses, banks, one-off gains, buybacks, capital-hungry firms, closely held shares), and cash flow, especially free cash flow, tests whether profit is real: the worked example shows a 16× P/E, 9× EV/EBITDA and free cash flow of about 91% of profit.
Four questions and two worked problems on this chapter. Decide on your answer first, then click “Reveal Answer.”
1. A company has revenue of $500m, cost of goods sold of $300m, operating expenses of $100m and depreciation and amortization of $20m. What is its EBIT?
- $80m
- $100m
- $200m
- $60m
Reveal Answer
Answer: A. Gross profit = $500m − $300m = $200m; EBITDA = $200m − $100m = $100m; EBIT = $100m − $20m = $80m.
2. A stock trades at $40. The company earned net profit of $50m and has 25m shares. What is its P/E ratio?
- 25×
- 16×
- 2×
- 20×
Reveal Answer
Answer: D. EPS = $50m ÷ 25m = $2.00; P/E = $40 ÷ $2.00 = 20.
3. Why do analysts usually set aside EV/EBITDA when valuing a bank?
- Banks are not permitted to report EBITDA to their investors
- Bank share prices are set by the central bank
- Deposits are its raw material, not a financing choice
- Banks own no equipment, so EBITDA equals net profit
Reveal Answer
Answer: C. For a bank, borrowed money is the business itself rather than a financing choice, so P/B and ROE are used instead.
4. A company’s net profit stays at $100m while buybacks cut its shares from 50m to 40m. What happens to EPS?
- It rises 25%
- It falls 20%
- It does not change
- It rises 20%
Reveal Answer
Answer: A. EPS goes from $100m ÷ 50m = $2.00 to $100m ÷ 40m = $2.50, and $2.50 ÷ $2.00 − 1 = 25%, with no growth in profit.
5. Worked problem: A company has revenue of $1,500m, net profit of $120m, 80m shares at $22, net debt of $400m and EBITDA of $260m. What are its P/E and EV/EBITDA?
Reveal Answer
Answer: EPS = $120m ÷ 80m = $1.50, so P/E = 14.67×. Market cap = $1,760m; EV = $2,160m; EV/EBITDA = 8.31×.
6. Worked problem: Free cash flow is $100m. What share of net profit is it, and what does that say about earnings quality?
Reveal Answer
Answer: $100m ÷ $120m = 83%: most of the profit is turning into cash.
- 15 U.S.C. §78m, Periodical and other reports (Cornell LII) — The periodic reporting that public companies must file
- SEBI circular SEBI/HO/IMD/DF3/CIR/P/2017/114, Categorization and Rationalization of Mutual Fund Schemes (Oct 6, 2017) — Large cap = ranks 1–100, mid 101–250, small 251+ by full market cap; AMFI list every six months; rebalance within one month; large-cap fund 80% and mid-cap fund 65% minimums (5.2, Part 5 India Lens)