
Asset managers pool savers’ money into funds priced at net asset value, and they charge an expense ratio that compounds into a large cost over decades. Index funds track a benchmark cheaply, and ETFs trade all day and stay near net asset value.
Why it matters: It shows how a small fee difference becomes a large cost over decades.
Summary: Asset managers pool savers’ money into funds priced at NAV and charge an expense ratio that compounds into a large cost over decades. Index funds track a benchmark cheaply, and ETFs trade all day and stay near NAV.
- US-registered funds held $45.1 trillion at year-end 2025, $31.4 trillion in mutual funds and $13.4 trillion in ETFs, and 76.0 million US households (56.4%) owned at least one fund.
- A fund with $1,020 million of securities and cash, $20 million of liabilities and 40 million shares outstanding has a NAV of $25.00.
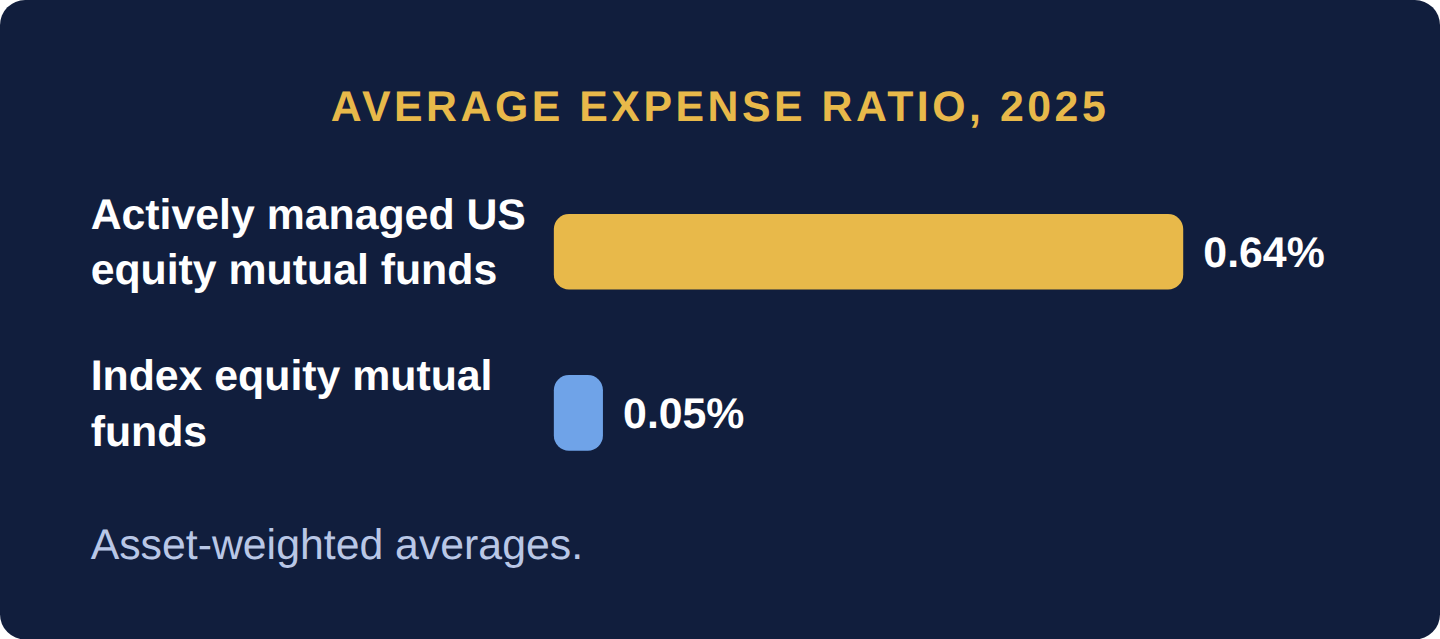
- In 2025 the asset-weighted average expense ratio was 0.64% for actively managed US equity mutual funds and 0.05% for index equity mutual funds.
- Over 30 years at an illustrative 7% before fees, the index fund ends with $75,063 against $63,584, so the active fund ends about 15% poorer.
- In 2025 investors put a record $1.5 trillion into US ETFs while pulling $1.2 trillion out of equity mutual funds.
Most people do not buy shares one company at a time; they buy a slice of a fund that owns hundreds. An active fund pays managers to pick winners; an index fund simply buys the whole index and charges a fraction of the fee. Because trillions of dollars now sit in funds, millions of savers adding or withdrawing money each month become waves of buying and selling that move entire markets.
An asset manager pools money from many savers and invests it under a stated mandate. The legal vehicle is the fund; the business that runs it for a fee is the asset management company (AMC), the official term in India. The fund’s securities sit with an independent custodian (Section 11.1: The Plumbing — Clearing Houses, Depositories, and Custodians), separate from the manager’s own balance sheet. Because the manager is paid a percentage of assets, the business rewards scale: in the US the 10 largest fund families manage most of the money in index mutual funds. US-registered funds held $45.1 trillion at year-end 2025, $31.4 trillion in mutual funds and $13.4 trillion in exchange-traded funds, and 76.0 million US households (56.4%) owned at least one fund.
A fund’s price is its net asset value (NAV) per share: (market value of everything the fund owns − what it owes) ÷ shares outstanding. A fund holding $1,020 million of securities and cash, owing $20 million in accrued fees and unsettled purchases, with 40 million shares outstanding, has a NAV of ($1,020,000,000 − $20,000,000) ÷ 40,000,000 = $25.00. A traditional open-end mutual fund calculates its NAV once a day after the market closes, and every order is filled at the next NAV calculated after it arrives (forward pricing), so nobody can trade on a stale price. Investors buy new shares from the fund and sell (redeem) them back to it, so when savers redeem more than they invest, the manager must sell holdings to raise cash.
The cost is the expense ratio: the fund’s annual operating expenses as a percentage of its assets, deducted from the fund itself and never billed separately. In 2025 the asset-weighted average was 0.64% for actively managed US equity mutual funds and 0.05% for index equity mutual funds; index equity ETFs averaged 0.14%.
Invest $10,000 for 30 years in two funds holding the same stocks, which earn an illustrative 7% a year before fees. Taking each fund’s net return as 7% minus its expense ratio:
| Fund | Net annual return | Value after 30 years |
|---|---|---|
| Index fund (0.05%) | 7% − 0.05% = 6.95% | $10,000 × 1.069530 ≈ $75,063 |
| Active fund (0.64%) | 7% − 0.64% = 6.36% | $10,000 × 1.063630 ≈ $63,584 |
The gap is $75,063 − $63,584 = $11,479, so the active fund ends about 15% poorer ($11,479 ÷ $75,063 ≈ 0.153) unless its manager beats the market by at least the fee difference every year. A fee under 1% looks small because it is quoted per year; it compounds like any other return.
An index fund buys all the securities in a published index, or a representative sample, in the index’s own proportions, so its return follows the index minus costs; how far and how erratically the fund’s return strays from the index is its tracking error. It needs no analysts, which is why it is cheap. Index mutual funds date from the 1970s and index ETFs from the 1990s. By year-end 2025 index funds held $19.1 trillion, 52% of US long-term fund assets, up from 19% in 2010, and index funds focused on US stocks owned 19% of the US stock market.
An exchange-traded fund (ETF) is a fund whose shares trade on an exchange all day, through the same order book as any stock (Section 4.1: What a Stock Exchange Actually Is), at a market price that can differ slightly from NAV. Most ETF money is in index funds, though active ETFs are growing. In 2025 investors put a record $1.5 trillion into US ETFs while pulling $1.2 trillion out of equity mutual funds. Since the SEC adopted Rule 6c-11 in September 2019, most ETFs can launch without an individual exemption, on condition that they publish their holdings every day.
An ETF’s price is set by trading, not by the fund, so something must stop it drifting away from the value of what it holds. That something is a set of large dealers called authorized participants (APs), which can create or redeem ETF shares directly with the fund in large blocks, usually by handing over or taking back the underlying basket of securities rather than cash. Suppose the basket behind each share is worth $50.00 (the NAV) and the ETF trades at $50.10, a premium of $50.10 ÷ $50.00 − 1 = 0.2%. An AP buys the basket for a 50,000-share block (50,000 × $50.00 = $2,500,000), delivers it to the fund for 50,000 new ETF shares, and sells them on the exchange for 50,000 × $50.10 = $2,505,000: $5,000 before trading costs. Its selling pushes the ETF price down and its basket buying pushes the holdings up until the gap no longer pays. A discount runs the trade in reverse: buy cheap ETF shares, redeem them for the basket, sell the basket. Retail investors never see this primary market; they buy and sell on the exchange, where ETFs accounted for 28% of daily US stock trading in 2025 (ICI).
The flows that move markets. A fund manager must invest whatever savers send, so flows become trades. New money in an index fund is spread across every stock in the index whatever its price, and when an index adds a company, every fund tracking it must buy that stock at the same moment; the BIS found that stocks joining the S&P 500 afterward move more closely with the index, trade more and carry narrower spreads. Flows are labeled by who sends them. A foreign portfolio investor (FPI) is a non-resident fund or institution that buys a country’s listed shares and bonds without taking control of companies; India’s older term, foreign institutional investor (FII), survives in market commentary, though SEBI now registers such investors under its Foreign Portfolio Investors Regulations, 2019. A domestic institutional investor (DII) is a local institution: mutual funds, insurers, pension funds and banks. Foreign money is counted in dollars, so it tends to leave emerging markets when US yields rise or the dollar strengthens (Section 2.10: The Federal Funds Rate: How the Fed Actually Sets the Price of Money) and to return when they ease. Domestic money arrives in local currency and, when it comes through standing monthly instructions, tends to keep arriving in a sell-off.
That standing instruction is a systematic investment plan (SIP): a fixed amount invested in a chosen fund every month, which buys more units when prices are low and fewer when they are high. It is India’s main channel for retail fund investing. The US equivalent is the payroll deduction into a 401(k) plan, where target-date funds and index funds take a fixed slice of every paycheck.
The case for passive investing starts with arithmetic. William Sharpe showed in 1991 that, because active and passive investors together own the whole market, the average actively managed dollar earns the same as the average passively managed dollar before costs, and so less after costs. The scorecards agree: S&P Dow Jones Indices found that 79% of active US large-cap funds trailed the S&P 500 in 2025, and 93% over the 20 years to December 2025. The case against unlimited passive growth is about the market rather than the saver. Prices carry information only if someone researches companies, and index funds free-ride on that work; index trading makes stocks move more in step; and a bond index gives the most weight to the issuers that borrow the most (BIS, 2018). Active managers add that they can avoid frauds and bubbles an index must hold. The evidence on costs is strong; the evidence on how large passive investing can grow before prices lose information is thin, and economists disagree about where that point lies. The heuristic most of the evidence supports for an individual: pay for active management only with a specific reason to expect skill that survives its fees.
The standard answers of Part 4: Stock Markets & IPOs: a fund trades at its NAV, an index fund is a passive bystander, and an IPO is open to every investor on equal terms. Each bends:
| Situation | What changes | Why |
|---|---|---|
| Mutual fund order placed after the daily cut-off | It is filled at the next day’s NAV | Forward pricing: every order gets the next NAV calculated after it arrives |
| Bond ETF when the underlying bonds stop trading | The ETF can trade well below its published NAV | The NAV relies on stale bond prices; the ETF price is the live estimate, and APs need tradable baskets to close the gap |
| Closed-end fund | Price can sit at a lasting discount or premium to NAV | A fixed number of shares and no creation or redemption, so no arbitrage forces the gap shut |
| Index addition day | Index funds buy the added stock at any price | Their mandate is to track the index, not to judge value |
| An index dominated by a few giants | A “diversified” index fund carries concentrated risk | Market-cap weighting puts the most money in the largest companies |
| Indian IPO without a profit track record | At least 75% goes to institutions and at most 10% to retail | SEBI’s allocation rule shifts the riskiest issues toward professional buyers (Section 4.6: The India IPO Process — SEBI, BSE, and NSE) |
| Oversubscribed US IPO | Individuals may get few or no shares | Underwriters have wide latitude and usually favor institutional and wealthy clients |
1. A Bengaluru startup raises Series C at a $900M valuation from a fund whose LPs include a Canadian pension plan. Trace the ownership chain from a Canadian teacher’s salary to the startup’s payroll. 2. Why might a company’s IPO price be set to “pop” 20% on day one — and who wins and loses from that pop? 3. A famous short seller publishes a report on a company you own. List what should determine your reaction — before checking chapter 4.8: Short Selling — Betting on Falling Prices‘s answer.
What is NAV?
Net asset value: a fund’s securities and cash minus its liabilities, divided by the shares outstanding. A fund with $1,020 million of securities and cash, $20 million of liabilities and 40 million shares has a NAV of $25.00.
What is the difference between an index fund and an actively managed fund?
An index fund tracks a benchmark cheaply. In 2025 the asset-weighted average expense ratio was 0.64% for actively managed US equity mutual funds and 0.05% for index equity mutual funds.
How big is the US fund industry?
US-registered funds held $45.1 trillion at year-end 2025, $31.4 trillion in mutual funds and $13.4 trillion in ETFs, and 76.0 million US households (56.4%) owned at least one fund.
How do ETFs differ from mutual funds?
ETFs trade all day and stay near net asset value.
India’s mutual fund industry, regulated by SEBI and represented by the Association of Mutual Funds in India (AMFI), managed ₹87.08 lakh crore at August 31, 2026, across 28.35 crore folios (an investor’s account in a scheme). A SIP (systematic investment plan, defined above) sends a fixed rupee amount into a scheme each month. Passive investing is smaller than in the US but no longer marginal: equity index funds (₹2.51 lakh crore) and equity ETFs (₹8.18 lakh crore) were (2.51 + 8.18) ÷ (39.21 + 2.51 + 8.18) = 10.69 ÷ 49.90 ≈ 21% of the money in open-end equity schemes, index funds and ETFs combined.
The market headline to watch is the tug of war between foreign and domestic institutions. Foreign portfolio investors trade in dollars and tend to sell Indian shares when US yields rise or the dollar strengthens (Section 2.10: The Federal Funds Rate: How the Fed Actually Sets the Price of Money). Domestic institutional investors, led by mutual funds, are fed by monthly SIP instructions in rupees that keep arriving when prices fall, so they can act as the buyer when foreign money leaves. That is why an FPI exit no longer falls on prices alone: the same shares pass from a seller who watches the dollar to a buyer who follows a saver’s calendar.
Asset managers pool savers’ money into funds priced at NAV, charging an expense ratio that compounds into a large cost over decades: 0.05% versus 0.64% cost about 15% of a 30-year outcome in the worked example. Index funds track a benchmark cheaply, ETFs trade all day and stay near NAV through authorized participants, and flows from foreign investors, domestic institutions and SIPs move markets. The evidence favors paying for active management only with a specific reason to expect skill that survives fees.
Four questions and two worked problems on this chapter. Decide on your answer first, then click “Reveal Answer.”
1. A fund holds $2,040 million of securities and cash and owes $40 million. It has 80 million shares outstanding. What is its NAV per share?
- $25.00
- $24.50
- $25.50
- $2,000.00
Reveal Answer
Answer: A. ($2,040,000,000 − $40,000,000) ÷ 80,000,000 = $25.00. Using assets without subtracting what the fund owes would give $25.50.
2. What does an index fund do?
- Picks the shares its analysts expect to beat the index
- Holds an index’s securities in its proportions, tracking it
- Buys only the shares of the ten largest fund families
- Guarantees a return above the index in falling markets
Reveal Answer
Answer: B. An index fund needs no analysts, so it is cheap; its return follows the index minus costs, and the gap is tracking error.
3. An ETF trades at $50.10 while the basket it holds is worth $50.00. What do authorized participants do?
- Ask the exchange to suspend trading in the fund shares
- Wait for the daily NAV to be recalculated after the close
- Sell the basket and redeem ETF shares at the fund
- Buy the basket, create ETF shares, sell them on exchange
Reveal Answer
Answer: D. Selling dear ETF shares and buying the cheaper basket earns the gap, and the trading pushes the two prices together.
4. Two funds hold the same stocks and earn 7% before fees. One charges 0.05% and the other 0.64%. What is the gap in annual net return?
- 0.05 percentage points
- 0.69 percentage points
- 7.00 percentage points
- 0.59 percentage points
Reveal Answer
Answer: D. 0.64% − 0.05% = 0.59 percentage points a year, which compounds to about 15% less after 30 years in the chapter’s example.
5. Worked problem: $10,000 grows at a 7% gross return for 30 years. Compare a fund charging 0.05% with one charging 0.90%.
Reveal Answer
Answer: 0.05%: $10,000 × 1.069530 = $75,063. 0.90%: $10,000 × 1.06130 = $59,083.
6. Worked problem: What share of the cheaper fund’s final value does the higher fee consume?
Reveal Answer
Answer: ($75,063 − $59,083) ÷ $75,063 = 21.3%.
- Sushko and Turner, BIS Quarterly Review, March 2018 — Index inclusion effects; bond index weights toward leveraged issuers
- SEC, ETF Rule adoption press release (2019) — Rule 6c-11 adopted September 26, 2019; daily holdings disclosure
- 17 CFR 270.22c-1 (forward pricing) — Fund orders priced at NAV next computed after receipt
- SEBI, Foreign Portfolio Investors Regulations, 2019 (as amended July 2026) — FPI registration framework
- SEBI, ICDR Regulations 2018 (as amended March 2026) — Regulation 6(2) 75%/10% and Regulation 32 allocation