
1.6 Petroleum and the Petrodollar System
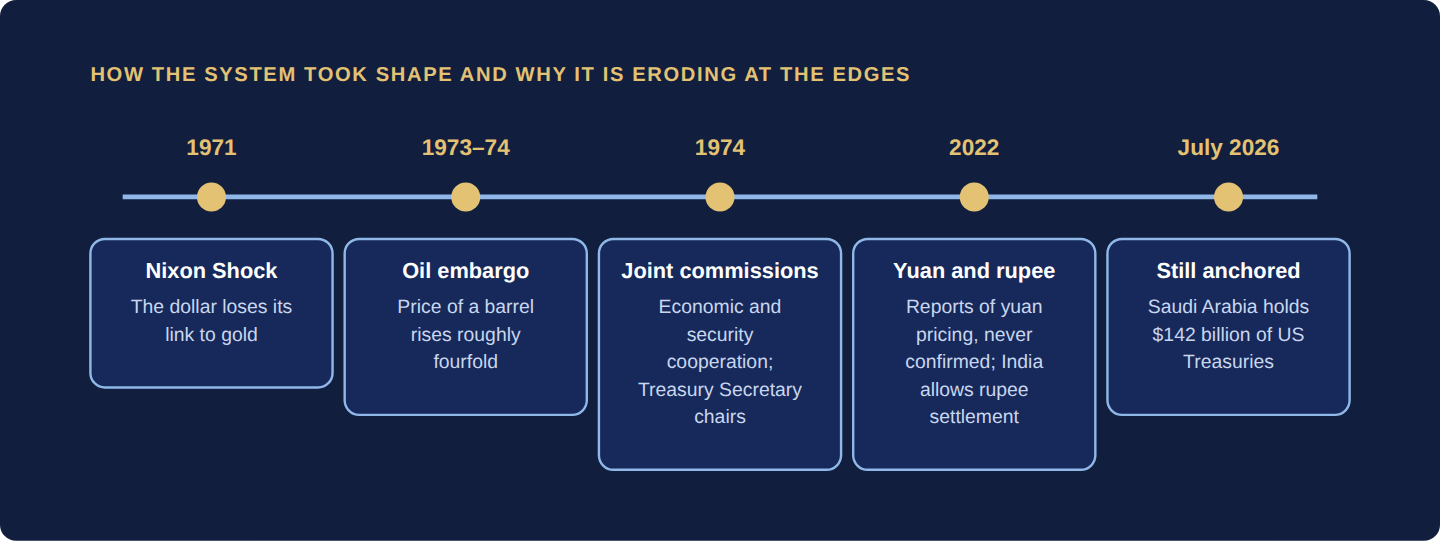
The petrodollar system means oil is priced, and mostly paid for, in US dollars, with the earnings recycled into US assets. It took shape after 1971 and the 1973–74 oil embargo. No treaty ever required dollar-only oil sales: the habit grew because dollar assets offered a deep, safe place for the money to go.
Why it matters: It is one reason the world needs dollars, and why the dollar stays strong.
Summary: Oil has been priced in dollars for decades, and the US–Saudi arrangements of 1974 entrenched the habit by giving oil revenue a deep, safe place to return in US assets. No treaty ever required dollar-only oil sales.
- After the Nixon Shock of 1971 and the 1973–74 Arab oil embargo, which pushed the price of a barrel up roughly fourfold, Washington moved to bind Saudi Arabia more closely to the dollar system.
- Saudi Arabia still held $142 billion of US Treasury securities in July 2026.
- Since July 2022 the RBI has allowed India’s trade to be invoiced and settled in rupees, and reports of Saudi yuan oil sales remain unconfirmed.
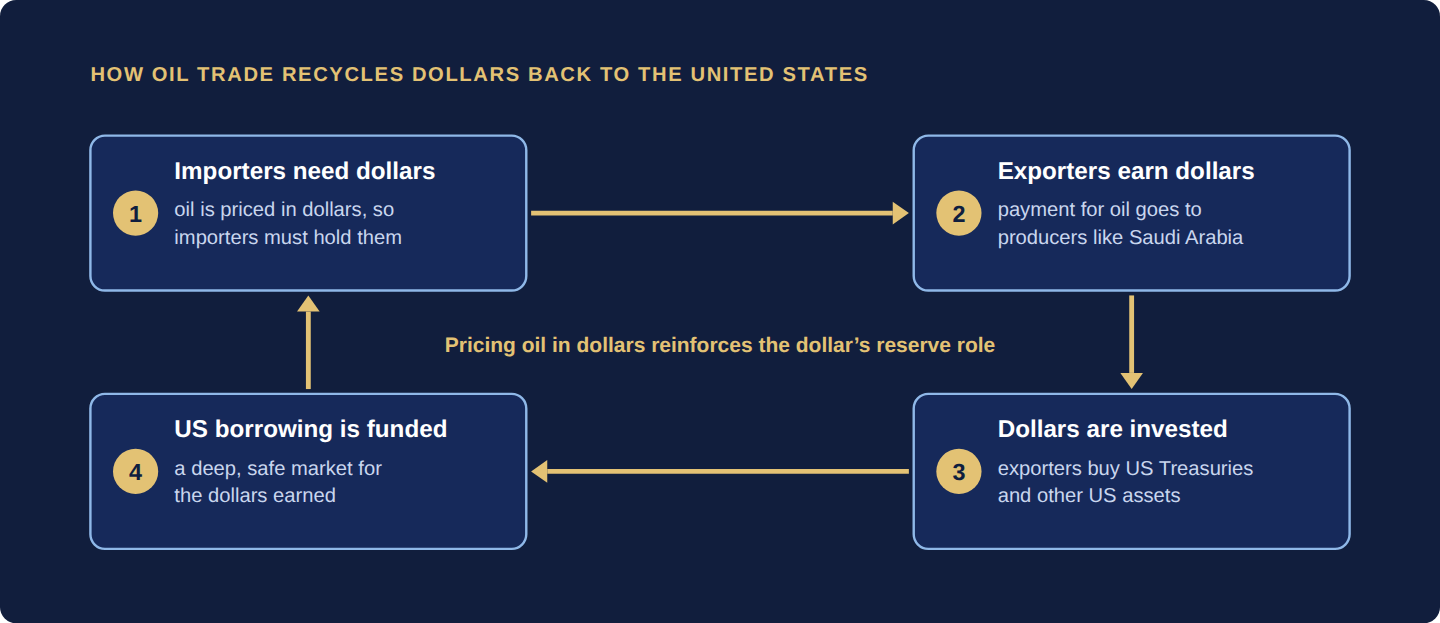
The petrodollar system is the arrangement in which oil, the world’s most important traded commodity, is priced and mostly settled in US dollars, and the dollars earned by exporters are reinvested in US assets. It reinforced the dollar’s role as the world’s reserve currency after the end of Bretton Woods.
Why oil matters so much
No commodity has shaped the modern global economy more profoundly than petroleum. Oil is not only fuel for cars, trucks and planes; it is the raw material for plastics, synthetic fibers, solvents, asphalt and thousands of industrial products. A currency that sits at the center of the oil trade sits at the center of the world economy.
How the system took shape
After the Nixon Shock of 1971 ended the dollar’s link to gold, and the 1973–74 Arab oil embargo pushed the price of a barrel up roughly fourfold, Washington moved to bind the largest oil exporter more closely to the dollar system. In 1974 it drew up plans for joint US–Saudi commissions on economic cooperation, chaired on the US side by the Secretary of the Treasury, and on security cooperation. The US supplied arms and security ties, and Saudi Arabia’s central bank built up large investments in US Treasury securities and other US assets.
What was and was not agreed
| Claim | What the record shows |
|---|---|
| A treaty obliged Saudi Arabia or OPEC to sell oil only for dollars | No published treaty ever did |
| Oil was priced in dollars because of the 1974 arrangements | Oil was already priced in dollars; the arrangements entrenched the habit |
| The dollars earned had somewhere to go | The arrangements gave them a deep, safe market to return to: Saudi Arabia still held $142 billion of US Treasury securities in July 2026 |
The mechanism
Because almost every barrel of oil was priced in dollars, every importing country, whether Japan, Germany, India, China or Brazil, had to maintain large dollar reserves. The dollar’s reserve currency status, threatened by the end of Bretton Woods, was structurally reinforced by the global oil trade.
Measuring the pull on dollars
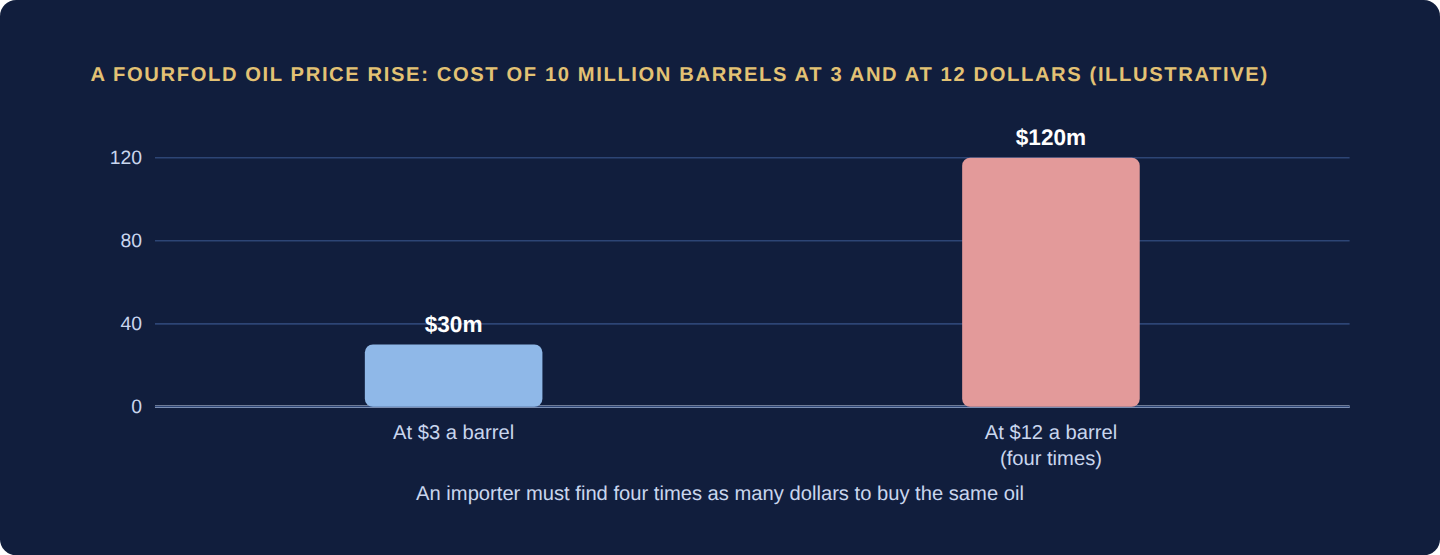
The demand for dollars from oil is simple arithmetic: barrels bought multiplied by the price in dollars. An importer buying 1 million barrels a day at $80 needs $80 million a day, or about $29.2 billion a year. When the price rises, the dollars needed rise in proportion.
Dollars needed = barrels × price per barrel
| Barrels | Price | Dollars needed |
|---|---|---|
| 10 million | $3 | $30 million |
| 10 million | $12 (four times) | $120 million |
| 1 million a day, for a year | $80 | About $29.2 billion |
Pressure at the edges
The arrangement is under gradual pressure, not collapse. Reports since 2022 that Saudi Arabia would price some oil sales to China in yuan have never been officially confirmed by either government. Sanctioned exporters such as Russia have every reason to sell oil for currencies other than the dollar, and since July 2022 the RBI has allowed India’s trade to be invoiced and settled in rupees. Yet the benchmark crude prices are still quoted in dollars and the large majority of oil trade is still settled in them, though no official statistic measures the exact share.
Common misreadings
“A treaty forced oil to be sold in dollars.” No published treaty did; the habit was entrenched by a deep, safe home for dollar earnings. “The petrodollar system has ended.” It is eroding at the edges, but benchmarks and most settlement remain in dollars. “It replaced Bretton Woods.” It is the second pillar of dollar dominance after Bretton Woods, not a substitute for it.
A method for judging a claim about dollar oil
- Separate pricing from settlement. Is the claim about how oil is quoted or about which currency actually changes hands?
- Ask for official confirmation. Have both governments confirmed it, or is it a report?
- Check the benchmark. Are the main crude benchmarks still quoted in dollars?
- Follow the dollars. Where do the earnings go: Treasuries, other assets or other currencies?
- Size the share. Remember that no official statistic measures the exact share of dollar settlement.
Practice problems
No commodity has shaped the modern global economy more profoundly than petroleum. Oil is not just fuel for cars, trucks and planes: it is the raw material for plastics, synthetic fibers, solvents, asphalt and thousands of industrial products.
After the Nixon Shock of 1971 ended the dollar’s link to gold, and the 1973–74 Arab oil embargo pushed the price of a barrel up roughly fourfold, Washington moved to bind the largest oil exporter more closely to the dollar system. In 1974 Washington drew up plans for joint US–Saudi commissions on economic cooperation, chaired on the US side by the Secretary of the Treasury, and on security cooperation; the US supplied arms and security ties, and Saudi Arabia’s central bank built up large investments in US Treasury securities and other US assets. No published treaty ever obliged Saudi Arabia or OPEC to sell oil only for dollars: oil was already priced in dollars, and the 1974 arrangements entrenched that habit by giving the dollars earned a deep, safe market to return to. Saudi Arabia still held $142 billion of US Treasury securities in July 2026.
The effect was lasting. Because almost every barrel of oil was priced in dollars, every importing country — Japan, Germany, India, China, Brazil, everyone — had to maintain large dollar reserves. The dollar’s reserve currency status, threatened by the end of Bretton Woods, was now structurally reinforced by the global oil trade. This is what economists call the petrodollar system.
Imagine that every person in the world who wanted to buy groceries had to first exchange their local currency into one specific supermarket’s gift card before they could shop anywhere. The supermarket issuing those cards would effectively control a choke point in the entire world’s food supply chain. The petrodollar system gave the United States a structurally similar position in the world economy — because everyone needed oil, and oil required dollars.
The arrangement is under gradual pressure, not collapse. Reports since 2022 that Saudi Arabia would price some oil sales to China in yuan have never been officially confirmed by either government. Sanctioned exporters such as Russia (Section 1.18: Sanctions — Finance as a Weapon) have every reason to sell oil for currencies other than the dollar, and since July 2022 the RBI has allowed India’s trade to be invoiced and settled in rupees. Yet the world’s benchmark crude prices are still quoted in dollars, and the large majority of oil trade is still settled in them, though no official statistic measures the exact share. What is happening is a slow erosion at the edges, not a switch.
The petrodollar system is the second great pillar of US dollar dominance after Bretton Woods. It explains why Gulf oil revenue flows back into US Treasury markets, why oil shocks show up in the dollar and in every importer’s currency (Section 1.13: Balance of Payments — The Complete Money-Flow Picture), and why each rumor of non-dollar oil pricing draws so much attention. Oil, dollars and US financial power are structurally intertwined.
What is the petrodollar system?
An arrangement in which oil is priced and mostly settled in US dollars, and the earnings are recycled into US assets.
How did the petrodollar system start?
After the Nixon Shock of 1971 and the 1973–74 Arab oil embargo, which pushed the price of a barrel up roughly fourfold, Washington moved to bind Saudi Arabia more closely to the dollar system.
Does oil have to be sold in dollars?
No. No treaty ever required dollar-only oil sales; the habit rests on infrastructure and a deep, safe market for dollar assets.
Is the petrodollar ending?
Not so far. Since July 2022 the RBI has allowed India’s trade to be invoiced and settled in rupees, and reports of Saudi yuan oil sales remain unconfirmed. Saudi Arabia still held $142 billion of US Treasury securities in July 2026.
- The petrodollar system prices and mostly settles oil in dollars and recycles the earnings into US assets.
- It took shape after the 1971 Nixon Shock and the 1973–74 embargo, which raised the oil price roughly fourfold.
- No published treaty obliged anyone to sell oil only for dollars; the habit was entrenched by a deep, safe home for dollar earnings.
- Importers must hold dollars to buy oil, which reinforces the dollar’s reserve role: dollars needed = barrels × price.
- The system is eroding at the edges, with unconfirmed yuan reports and rupee settlement, but benchmarks and most settlement remain in dollars.
Four questions and three worked problems on this chapter. Decide on your answer first, then click “Reveal Answer.”
1. Which statement about the 1974 US–Saudi arrangements is accurate?
- They pegged the price of a barrel of oil to the price of gold in ounces
- They deepened economic and security ties and recycled oil revenue into US assets
- They made Saudi Arabia a founding member of the Bretton Woods system in 1944
- A published treaty required OPEC members to sell oil only for US dollars
Reveal Answer
Answer: B. No published treaty mandated dollar-only oil sales; oil was already priced in dollars and the 1974 ties reinforced that habit.
2. Why did dollar pricing of oil strengthen the dollar’s global role?
- Oil exporters were barred from holding other currencies
- The Fed set the world price of oil each month
- Every oil importer needed to hold dollars to pay for oil
- Oil importers had to borrow only from US banks
Reveal Answer
Answer: C. Because oil was priced in dollars, importers from Japan to India had to keep large dollar reserves.
3. What is the status of reports that Saudi Arabia priced oil sales to China in yuan?
- They have never been officially confirmed by either government
- Most Saudi oil sales to China are now settled in yuan by treaty
- Saudi Arabia formally ended dollar pricing of oil in 2023
- The US Treasury approved yuan sales in a 2024 trade accord
Reveal Answer
Answer: A. The yuan oil sale has been reported but not officially confirmed, and benchmark crude is still quoted in dollars.
4. Where does much of the Gulf’s oil revenue end up, according to the chapter?
- Held as physical cash in Gulf central bank vaults
- Lent to oil importers at zero interest
- Converted into gold at a fixed official price
- Invested in US assets such as Treasury securities
Reveal Answer
Answer: D. Saudi Arabia held $142 billion of US Treasury securities in July 2026, part of the recycling of oil dollars into US markets.
5. Worked problem: An importer buys 1 million barrels a day at $80. How many dollars does it need per day and per year?
Reveal Answer
Answer: Per day: 1,000,000 × $80 = $80 million. Per year: 80 × 365 = 29,200, or about $29.2 billion.
6. Worked problem: Oil rises roughly fourfold, from $3 to $12 a barrel. How does the cost of 10 million barrels change?
Reveal Answer
Answer: At $3 it costs $30 million; at $12 it costs $120 million, which is four times as much. The importer must find four times the dollars.
7. Worked problem: A news report says a country will sell some oil in yuan. List two checks before concluding the petrodollar system is ending.
Reveal Answer
Answer: (1) Has either government officially confirmed it? Reports about Saudi sales to China never were. (2) Are the benchmark prices still quoted in dollars and the bulk of trade still settled in them? They are.
1.7 Foreign Exchange Reserves — Why Countries Keep Piles of Other Countries' Money
Foreign exchange reserves are a country’s buffer of foreign currencies and gold, held to defend its currency, pay for imports and service foreign debt. The 2022 freezing of Russia’s reserves showed that money held in another country’s system carries political risk.
Why it matters: Reserves decide whether a country can ride out a currency crisis.
Summary: Foreign exchange reserves are a country’s buffer of foreign currencies and gold, held to defend the currency, pay for imports and service foreign debt. The 2022 freezing of Russia’s reserves showed that reserves held in other countries’ systems carry political risk.
- Of roughly $13.2 trillion in official foreign-currency reserves (gold excluded), 56.7% was held in US dollars in mid-2026, according to the IMF.
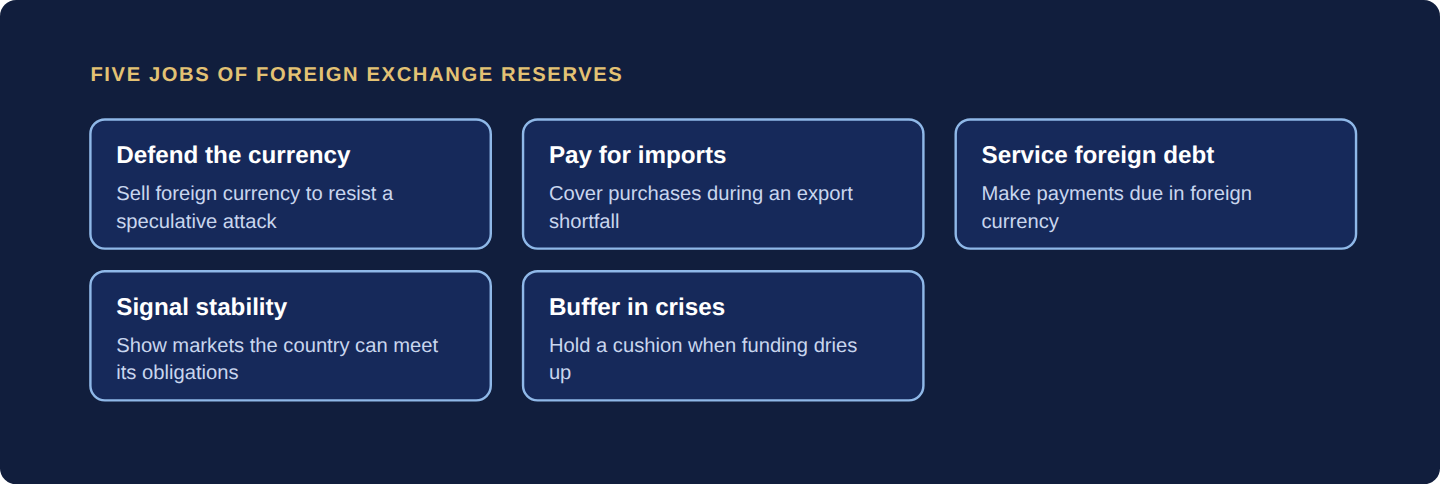
- Countries hold reserves to defend their currency from speculative attack, pay for imports during export shortfalls, service foreign-currency debt, signal stability and keep a buffer for crises.
- The risk of freezes is prompting China, Russia and other central banks to consider holding more reserves in gold or in each other’s currencies.
Foreign exchange reserves are holdings of foreign currencies, gold and other internationally accepted assets maintained by a country’s central bank. They work as a national savings account held in foreign currency.
Why countries hold them
Countries hold reserves to defend their currency from speculative attack, pay for imports during export shortfalls, service foreign-currency debt, signal financial stability and keep a buffer for crises. Of the world’s roughly $13.2 trillion in official foreign-currency reserves, gold excluded, 56.7% was held in US dollars in mid-2026, according to the IMF.
Who holds what
| Country | Approximate reserves | Notes |
|---|---|---|
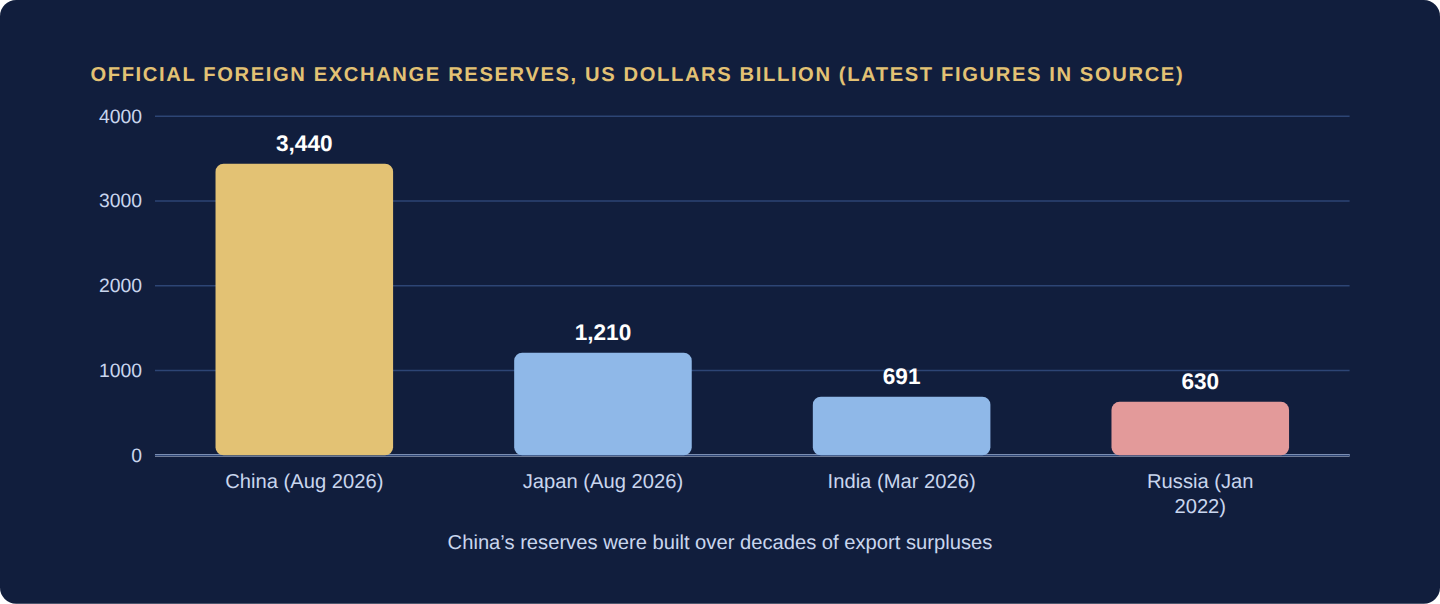
| China | $3.44 trillion (Aug 2026) | World’s largest, accumulated through decades of export surpluses |
| Japan | $1.21 trillion (Aug 2026) | About $840 billion in foreign securities; also the largest foreign holder of US Treasuries at $1.10 trillion in July 2026 |
| India | $691 billion (Mar 2026), including 880 t of gold | Used actively to manage rupee volatility; covers about 10.8 months of imports |
| Russia | $630 billion (Jan 2022, before sanctions) | About €210 billion was immobilized in the EU alone after February 2022 |
Measuring whether reserves are enough
Size alone does not tell a country whether its reserves are adequate. Two measures compare reserves with the obligations they must meet.
Import cover (months) = reserves ÷ monthly imports
India’s $691 billion covering about 10.8 months of imports implies monthly imports of about 691 ÷ 10.8 = $64 billion. A second measure compares reserves with debt due within a year in foreign currency; a ratio of at least 1 means the country could repay that debt from reserves alone.
Short-term debt cover = reserves ÷ foreign-currency debt due within one year
| Measure | Calculation | Illustrative result |
|---|---|---|
| Import cover | $120 billion ÷ $20 billion a month | 6 months |
| Short-term debt cover | $120 billion ÷ $90 billion due within a year | 1.33 |
| Cover after a $5 billion sale to defend the currency | $115 billion ÷ $20 billion a month | 5.75 months |
The cost of defending a currency
When a central bank sells reserves to support its currency, reserves fall and so does cover. The same $5 billion sale that looks small in a large stockpile can be significant when reserves are modest. That is why reserves are watched closely when a currency is under pressure.
Political risk
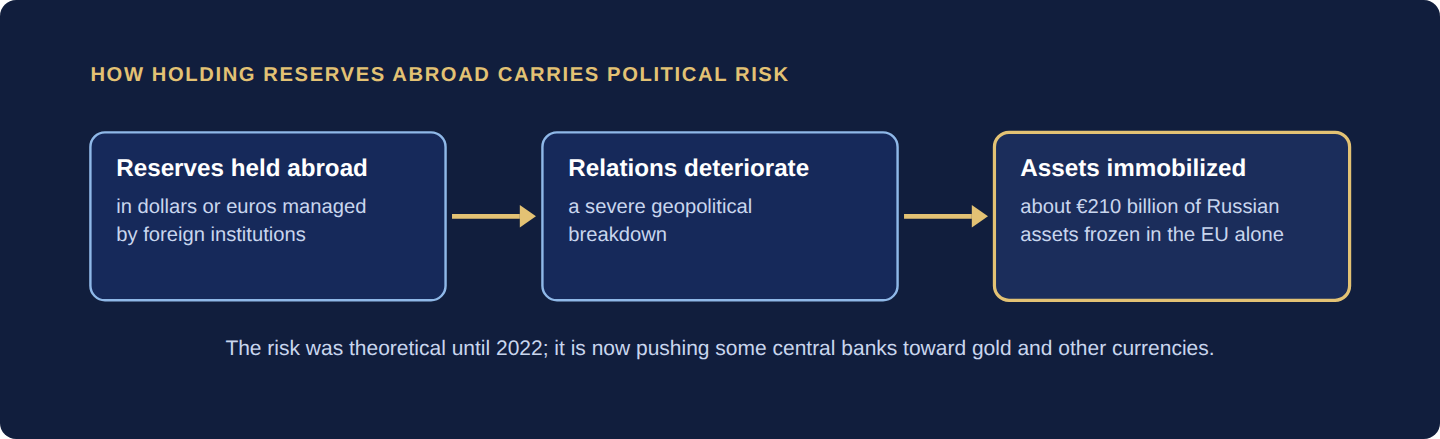
Russia’s position after 2022 illustrated a risk that had been theoretical: if a country holds its reserves in US dollars or euros managed by Western institutions, those reserves can be frozen or seized if relations deteriorate severely. About €210 billion was immobilized in the EU alone. Russia’s reported total, $769 billion in August 2026, still counts the frozen assets. The episode is prompting China, Russia and some other central banks to consider holding more reserves in gold or in each other’s currencies.
Common misreadings
“Bigger reserves always mean safer.” Adequacy depends on obligations such as imports and short-term debt. “Reserves are money the government can spend.” They are assets of the central bank held for stability. “Reported reserves are all usable.” Assets held abroad can be immobilized, as Russia’s were.
A method for assessing reserves
- Find the size. What are total reserves, and how much is gold?
- Compute import cover. Divide reserves by monthly imports.
- Compute debt cover. Divide reserves by foreign-currency debt due within a year.
- Check the location. Where are the reserves held, and who controls them?
- Check the use. Are they being sold to defend the currency, and how fast?
Practice problems
Foreign exchange reserves are holdings of foreign currencies, gold, and other internationally accepted assets maintained by a country’s central bank — essentially a national savings account held in foreign currency. Countries hold them to defend their currency from speculative attack, pay for imports during export shortfalls, service foreign-currency debt, signal financial stability, and maintain a buffer in crises. Of the world’s roughly $13.2 trillion in official foreign-currency reserves (gold excluded), 56.7% was held in US dollars in mid-2026, according to the IMF.
| Country | Approximate Reserves | Key Notes |
|---|---|---|
| China | $3.44 trillion (foreign exchange, Aug 2026) | World’s largest — accumulated through decades of export surpluses |
| Japan | $1.21 trillion (Aug 2026) | About $840 billion of it in foreign securities; Japan was also the largest foreign holder of US Treasuries, at $1.10 trillion in July 2026 |
| Switzerland | CHF 813 billion of foreign-currency investments (Aug 2026) | Disproportionately large for a small country; built up largely by the Swiss National Bank buying foreign currency to restrain the franc |
| India | $691 billion (Mar 2026), including 880 t of gold | RBI uses reserves actively to manage INR volatility; enough to cover about 10.8 months of imports |
| Russia | $630 billion (Jan 2022, before sanctions) | About €210 billion was immobilized in the EU alone after February 2022 — reserves in foreign-controlled systems carry political risk. Russia’s reported total ($769 billion in Aug 2026) still counts the frozen assets and a gold stock worth $333 billion |
Russia’s reserve situation after 2022 illustrated a risk that had previously been theoretical: if a country holds its reserves in US dollars or euros managed by Western institutions, those reserves can be frozen or seized if geopolitical relations deteriorate severely. This risk is now prompting China, Russia and other BRICS members, and some other central banks, to consider holding more reserves in gold or in each other’s currencies — a direct driver of the de-dollarization trends discussed in Part 2: The US Economy.
What are foreign exchange reserves?
A central bank’s foreign currencies, gold and other international assets, held to defend the currency, pay for imports and service foreign-currency debt.
Why do countries hold foreign exchange reserves?
To defend the currency from speculative attack, pay for imports during export shortfalls, service foreign-currency debt, signal stability and keep a buffer for crises.
How much reserve is enough?
Two tests: import cover (reserves ÷ monthly imports) and short-term debt cover. India’s $691 billion covers about 10.8 months of imports.
Which currency do central banks hold most?
Of roughly $13.2 trillion in official foreign-currency reserves, 56.7% was held in US dollars in mid-2026, according to the IMF.
- Foreign exchange reserves are a central bank’s foreign currencies, gold and other international assets, held to defend the currency, pay for imports, service foreign debt and buffer crises.
- About $13.2 trillion is held worldwide, of which 56.7% is in US dollars; China holds the most.
- Adequacy is measured by import cover (reserves ÷ monthly imports) and short-term debt cover.
- India’s $691 billion covers about 10.8 months of imports.
- Reserves held in foreign-controlled systems carry political risk, as the 2022 freeze of Russian assets showed.
Four questions and three worked problems on this chapter. Decide on your answer first, then click “Reveal Answer.”
1. Which country holds the world’s largest foreign exchange reserves?
- China
- Switzerland
- India
- Japan
Reveal Answer
Answer: A. China’s foreign exchange reserves were about $3.44 trillion in August 2026, built up through decades of export surpluses.
2. Roughly what share of the world’s official foreign-currency reserves was held in US dollars in mid-2026?
- About 25%
- About 85%
- About 57%
- About 40%
Reveal Answer
Answer: C. The IMF’s COFER data put the dollar’s share at 56.7% in the second quarter of 2026.
3. What did the 2022 sanctions on Russia show about reserves?
- Gold reserves held at home can be seized by sanctions
- Reserves lose their value whenever oil prices fall
- Reserves cannot be used to defend a currency in a war
- Reserves held in foreign-controlled systems can be frozen
Reveal Answer
Answer: D. About €210 billion of Bank of Russia assets was immobilized in the EU alone, a political risk that pushes some countries toward gold.
4. Which is NOT a reason the chapter gives for holding foreign exchange reserves?
- To pay for imports during a shortfall in export earnings
- To pay domestic government salaries in local currency
- To service foreign-currency debt when it falls due
- To defend the currency from a speculative attack
Reveal Answer
Answer: B. Reserves are foreign-currency assets for external needs; domestic salaries are paid in local currency.
5. Worked problem: A country holds $120 billion of reserves and imports $20 billion a month. What is its import cover?
Reveal Answer
Answer: 120 ÷ 20 = 6 months.
6. Worked problem: Of $13.2 trillion in global foreign-currency reserves, 56.7% is in dollars. How many dollars of reserves is that?
Reveal Answer
Answer: 13.2 × 0.567 = about $7.48 trillion.
7. Worked problem: The same country sells $5 billion of reserves to defend its currency. What is its import cover afterward?
Reveal Answer
Answer: Reserves fall to 120 − 5 = 115. Cover = 115 ÷ 20 = 5.75 months.
1.8 Inflation and Deflation — Why Prices Rise and Fall
Inflation is a rise in the general price level, measured as headline (all items) or core (excluding food and energy). The Fed targets 2% PCE inflation and the RBI targets 4% headline CPI, with a band of 2 points either side. Both demand-pull and cost-push causes played a part in the 2021–23 surge.
Why it matters: Inflation decides whether a pay raise, a savings rate or a loan is really good value.
Summary: Inflation is measured as headline (all items) or core (excluding food and energy); the Fed targets PCE inflation at 2%, while the RBI targets headline CPI at 4% with a band of 2 percentage points either side. Demand-pull and cost-push causes both played a part in the 2021–23 surge.
- In June 2022 US headline CPI inflation was 9.1% and core was 5.9%; the 3.2-point gap was food and energy.
- A 4% pay raise in a year of 3.4% inflation is a real raise of only 0.58%.
- Food and beverages carry 36.75% of the weight in India’s new CPI series (base year 2024), down from 45.86% in the old 2012 series.
- The 2021–2023 episode was the sharpest peacetime price surge in four decades, and COVID-19 supply chain disruptions were its first trigger.
Inflation is when prices rise over time, meaning each unit of money buys a little less than it used to. Deflation is the opposite — prices falling over time. Inflation is most commonly measured using the CPI (Consumer Price Index), which tracks the price of a representative basket of everyday goods and services — food, housing, transport, clothing, healthcare — over time, each weighted by its share of household spending.
A small, steady amount of inflation — around 2% annually — is considered healthy in most modern economies. It encourages spending rather than hoarding, supports manageable debt servicing, and gives central banks room to cut interest rates if the economy weakens. Deflation, counterintuitively, is often more dangerous than moderate inflation: when prices are falling, consumers delay purchases waiting for lower prices, businesses delay investment, and the economy can spiral into stagnation.
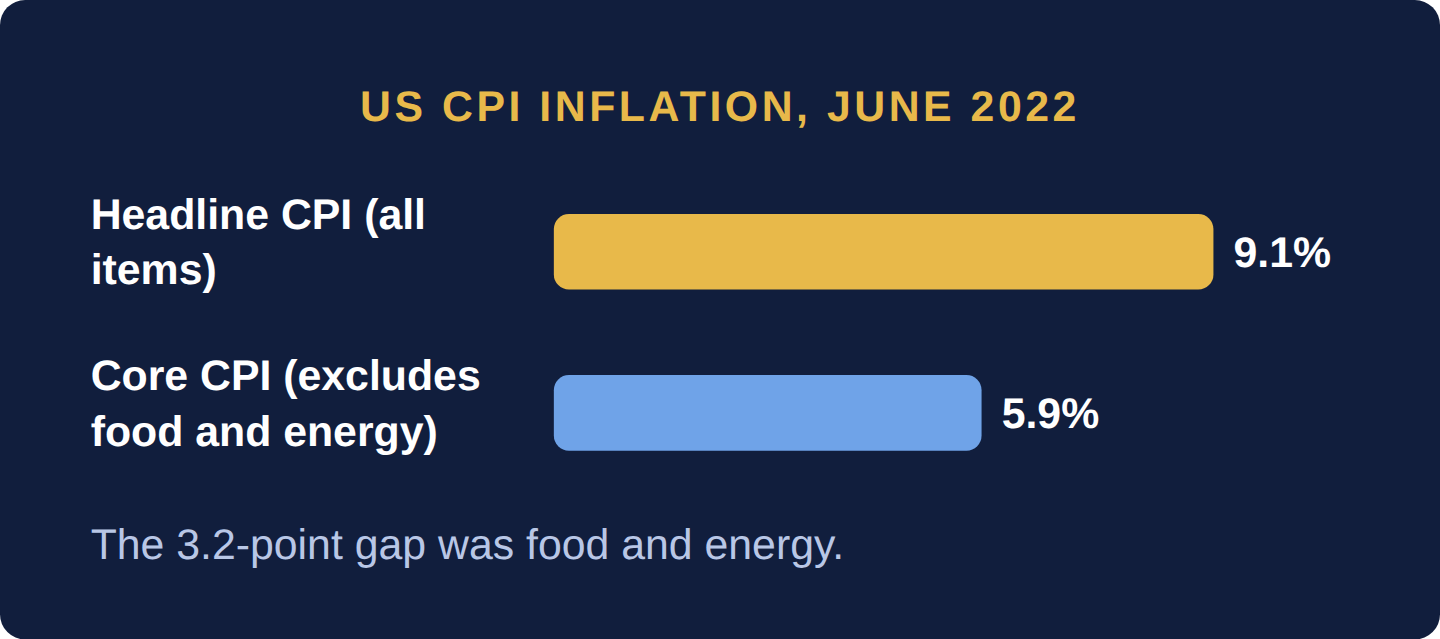
How inflation is measured. Headline inflation is the change in the price of the whole basket. Core inflation leaves out food and energy, whose prices swing with harvests, weather and wars, to show the underlying trend. In June 2022 US headline CPI inflation was 9.1% while core was 5.9%: the 3.2-point gap was food and energy. The US has two main gauges. The CPI, from the Bureau of Labor Statistics, measures what households pay out of pocket. The PCE price index (personal consumption expenditures), from the Bureau of Economic Analysis, also covers spending made on households’ behalf, such as medical care paid for by employers and government programs, uses a different formula and weights, and is the index behind the Federal Reserve’s 2% target. The two can differ by half a point or more:
| Measure (United States) | Published by | 12-month change, August 2026 |
|---|---|---|
| CPI, all items (headline) | BLS | 3.4% |
| CPI less food and energy (core) | BLS | 2.4% |
| PCE price index (headline) | BEA | 3.4% |
| PCE less food and energy (core) | BEA | 3.0% |
Nominal values are in today’s dollars; real values are adjusted for prices. A 4% pay raise in a year of 3.4% inflation is a real raise of 1.04 ÷ 1.034 − 1 = 0.58%. The same correction turns nominal interest rates into real ones (Section 1.5: Gold — The Timeless Monetary Anchor) and nominal GDP into real GDP (Section 1.3: GDP — Measuring the Size of an Economy).
Why prices rise. Demand-pull inflation happens when total spending grows faster than the economy can produce: more money chasing the same goods. Cost-push inflation happens when production costs jump (oil, wages, shipping) and firms pass them on even though demand has not grown. A supply shock is a sudden cost-push event such as a war or a failed harvest. The difference matters: higher interest rates cool demand directly, but they cannot pump oil or grow wheat, so against a supply shock they work only by slowing everything else.
India measures it differently. The RBI’s target is 4% with a tolerance band of 2 percentage points either side, retained in March 2026 for April 2026 to March 2031, and it is set on headline CPI, food included. Food and beverages carry 36.75% of the weight in the new CPI series (base year 2024, first published for January 2026), down from 45.86% in the old 2012 series. With more than a third of the basket in food, a weak monsoon can push up headline inflation, and with it the RBI’s decisions. The Wholesale Price Index (WPI), rebased to 2022-23 from June 2026, tracks goods prices at the producer and wholesale stage; it signals cost pressure early but is not the policy target.
If your monthly allowance stays exactly the same every year, but the price of your favorite snack keeps creeping up a little each year, you can buy slightly less candy each year with the same money. That shrinking buying power, multiplied across everything people buy, is what inflation feels like for a whole economy. Deflation is the reverse — your money buys more each year, which sounds nice, but it means businesses earn less, cut wages, and lay people off in a self-reinforcing downward spiral.
Case Study: The 2021–2023 Global Inflation Spike
The 2021–2023 inflationary episode was the sharpest peacetime price surge in four decades, and a textbook example of how multiple inflation triggers can collide simultaneously.
The triggers: First, COVID-19 caused massive supply chain disruptions — factories closed, shipping containers were stranded, semiconductor production lagged global demand. At the same time governments spent heavily to protect incomes (the US American Rescue Plan of March 2021 alone added about $1.8 trillion to deficits, by the Congressional Budget Office’s estimate), creating a surge of demand precisely when supply was constrained. Then, in February 2022, Russia invaded Ukraine, sending energy and food prices sharply higher; the two countries together supplied about 30% of world wheat exports, and the FAO Food Price Index hit its highest level on record (since 1990) in March 2022.
The peak: US CPI inflation reached 9.1% in June 2022, the highest since 1981 (core: 5.9%). UK inflation hit 11.1% and euro area inflation 10.6%, both in October 2022. India’s CPI inflation rose to 7.8% in April 2022, with food, fuel and core prices all rising.
The central bank response: The US Federal Reserve, having held rates near zero since March 2020, began raising them in March 2022, one of the most aggressive tightening cycles in modern history. By July 2023 the federal funds target range had reached 5.25–5.50%, up from 0–0.25% in 16 months. The RBI raised its repo rate from 4% to 6.5% between May 2022 and February 2023. The European Central Bank and Bank of England undertook similar campaigns.
The outcome: By June 2024 US CPI inflation had fallen to 3.0% without a recession (NBER has dated none since April 2020), the outcome economists call a soft landing, historically rare. The last stretch proved sticky: headline CPI inflation was still 3.4% in August 2026. The cost was substantial: the average US 30-year mortgage rate went from 3.22% in early January 2022 to 7.79% in late October 2023, more than doubling the interest on a new home loan (Section 1.9: Interest Rates — The Price of Borrowing Money). The episode demonstrated every concept in sections 1.8 and 1.9: demand-pull and cost-push inflation, a supply shock, headline versus core measurement, and the central bank’s interest-rate response.
Economists still argue over the weights. The supply camp points to an analysis by Adam Shapiro at the Federal Reserve Bank of San Francisco (June 2022), which attributed about half of the run-up to supply factors and about a third to demand, and to Ben Bernanke and Olivier Blanchard (NBER, June 2023), who found that most of the surge that began in 2021 came from price shocks (energy, food, shortages) rather than an overheated labor market. The demand camp points to work by Òscar Jordà and coauthors at the same Fed bank (March 2022), which estimated that US pandemic income transfers added about 3 percentage points to inflation by late 2021, one reason US inflation outran that of other rich countries.
The two camps share one conclusion. Bernanke and Blanchard found that the labor-market effect, though smaller at first, lasts longer than product-market disruptions, so restoring stable prices required balancing labor demand and labor supply: work that interest rates do, slowly.
What is the difference between headline and core inflation?
Headline counts all items; core excludes food and energy. In June 2022 US headline CPI inflation was 9.1% and core was 5.9%, a 3.2-point gap that was food and energy.
What inflation rate do central banks target?
The Fed targets 2% PCE inflation. The RBI targets headline CPI at 4% with a band of 2 percentage points either side.
What causes inflation?
Demand-pull, when spending outruns supply, and cost-push, when input costs rise. Both played a part in the 2021–23 surge.
How do I work out my real pay raise?
Compare the raise with inflation. A 4% raise in a year of 3.4% inflation is a real raise of only 0.58%.
Inflation is measured as headline (all items) or core (excluding food and energy); the Fed targets PCE inflation at 2%, while the RBI targets headline CPI at 4% ± 2%, with food 36.75% of India’s new CPI basket. Demand-pull inflation comes from spending outrunning output and cost-push from rising costs; the 2021–23 surge combined both, and economists still disagree over the weights.
Four questions and two worked problems on this chapter. Decide on your answer first, then click “Reveal Answer.”
1. What does core inflation leave out of the price basket?
- Food and energy
- Imported goods
- Housing and rent
- Government services
Reveal Answer
Answer: A. Core strips out food and energy, whose prices swing with harvests and wars, to show the underlying trend.
2. Which price index defines the Federal Reserve’s 2% inflation target?
- The Consumer Price Index
- The PCE price index
- The Producer Price Index
- The GDP price index
Reveal Answer
Answer: B. The FOMC defines its 2% goal on the annual change in the price index for personal consumption expenditures.
3. Your pay rises 4% in a year when inflation is 3.4%. What is your real raise, roughly?
- About 1.2%
- About 3.4%
- About 0.6%
- About 7.4%
Reveal Answer
Answer: C. Real raise = 1.04 ÷ 1.034 − 1 ≈ 0.58%.
4. A failed harvest pushes food prices up while total spending is unchanged. What kind of inflation is this?
- Demand-pull inflation from easy credit
- Deflation caused by falling demand
- Core inflation from rising wages
- Cost-push inflation from a supply shock
Reveal Answer
Answer: D. Rising production costs passed on to buyers, without extra demand, is cost-push; a sudden event like a harvest failure is a supply shock.
5. Worked problem: Prices rise 3% a year for 10 years. What does a price index starting at 100 reach?
Reveal Answer
Answer: 100 × 1.0310 = 134.4, a 34.4% rise in the price level.
6. Worked problem: A savings account pays 5% while inflation is 3%. What is the real return?
Reveal Answer
Answer: Real return = 1.05 ÷ 1.03 − 1 = 1.94%, not 2.00%.
- RBI, International Trade Settlement in INR (July 11, 2022)
- US State Department, Oil Embargo 1973–1974
- US State Department, FRUS: Joint US–Saudi Cooperation memo (April 1974)
- US Treasury, TIC Major Foreign Holders of Treasury Securities
- IMF, COFER
- RBI, Report on Management of Foreign Exchange Reserves
- Council of the EU, sanctions against Russia
- Office of the Economic Adviser, WPI 2022-23 series