
2.6 BRICS and the Challenge to Dollar Dominance
BRICS nations are pursuing de-dollarization through parallel, gradual initiatives, not one dramatic action. The dollar’s share of global reserves has fallen but remains overwhelming, and India is cautious.
Why it matters: It shows how slowly the dollar’s dominance is changing.
Summary: BRICS nations are pursuing de-dollarization through a set of parallel, gradual initiatives rather than one dramatic action. The dollar’s share of global reserves has fallen but remains overwhelming, and India is cautious.
- BRICS began as “BRIC”, an idea coined by Goldman Sachs economist Jim O’Neill in 2001; South Africa joined in 2010, and the group now represents about 48% of the world’s population and roughly 40% of global GDP by purchasing power parity.
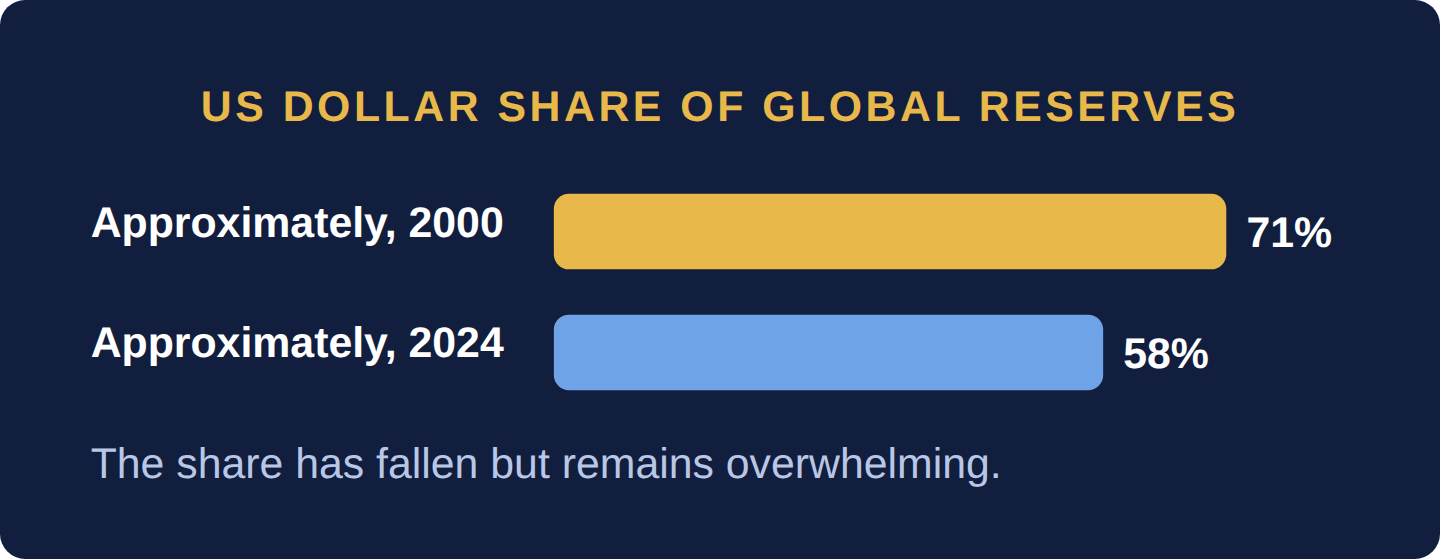
- The dollar’s share of global reserves declined from approximately 71% in 2000 to approximately 58% in 2024.
- Russia’s President has said a single shared BRICS currency is not currently a goal, and India’s government has said replacing the dollar is not its policy.
BRICS began as “BRIC,” an investment concept coined by Goldman Sachs economist Jim O’Neill in 2001, identifying Brazil, Russia, India, and China as the fastest-growing major economies of the coming decades. The four held their first leaders’ summit in 2009, added South Africa in 2010 to make it BRICS, and have since expanded to include Egypt, Ethiopia, Iran, the UAE, and Indonesia, with a broader circle of partner countries. BRICS nations now represent nearly half (about 48%) of the world’s population and roughly 40% of global GDP by purchasing power parity.
One of BRICS’s central ongoing projects is de-dollarization — reducing international trade and finance’s dependence on the US dollar. This is not a single dramatic action but a set of parallel, gradual initiatives:
| Initiative | What It Actually Is | Current Status |
|---|---|---|
| Local-currency trade settlement | Paying for trade directly in the two countries’ own currencies, skipping the dollar conversion step | Growing but small. Since July 2022 the RBI has allowed India’s exports and imports to be invoiced and settled in rupees; reports of Saudi oil sold to China in yuan have never been officially confirmed |
| BRICS Pay | Linking national payment systems as an alternative to dollar-based SWIFT | Early development; not yet operational at scale |
| New Development Bank (NDB) | A BRICS-founded multilateral lender increasingly issuing loans in members’ own currencies | Active; has issued local-currency bonds; modest scale compared to World Bank/IMF |
| Gold accumulation | China and India have been significant gold buyers, alongside Poland and Turkey, among the largest central bank buyers in recent years | Ongoing and substantial |
| “The Unit” (proposed) | A proposed gold-backed settlement unit for intra-BRICS trade | Still at discussion stage; far from implementation |
Important nuance: Russia’s President has explicitly stated that a single shared BRICS currency is not currently a goal. India’s government has been particularly measured, publicly stating that a stable US dollar supports global economic stability and that replacing it is not India’s policy. (On rupee invoicing, see the RBI circular of July 11, 2022.) The dollar’s share of global reserves has declined from approximately 71% in 2000 to approximately 58% in 2024 — a significant shift, but still overwhelming dominance. What is changing is the trajectory and the awareness that the dominance is not permanent.
This is the live, current contest over the future of global monetary order. The petrodollar system, reserve currency status, and sanctions power are all interlinked. Countries resisting US sanctions are the most aggressive de-dollarizers. Countries deeply integrated into the US financial system — like India — are cautious. The outcome, whether gradually multipolar or remaining dollar-centric, will shape global finance for decades. Anyone working in finance should follow this story closely.
What is BRICS?
A group that began as BRIC, an idea coined by Goldman Sachs economist Jim O’Neill in 2001. South Africa joined in 2010, and the group now represents about 48% of the world’s population and roughly 40% of global GDP by purchasing power parity.
What is de-dollarization?
Reducing reliance on the US dollar. BRICS nations are pursuing it through a set of parallel, gradual initiatives rather than one dramatic action.
How much has the dollar’s share of global reserves fallen?
From approximately 71% in 2000 to approximately 58% in 2024, which still leaves it overwhelming.
Is there a BRICS currency?
Not at present. Russia’s President has said a single shared BRICS currency is not currently a goal, and India’s government has said replacing the dollar is not its policy.
BRICS nations are pursuing de-dollarization through gradual, parallel steps. The dollar’s share of global reserves fell from about 71% in 2000 to about 58% in 2024 but remains overwhelming, and a single BRICS currency is not a stated goal.
Four questions and two worked problems on this chapter. Decide on your answer first, then click “Reveal Answer.”
1. What is the status of reports that Saudi Arabia sells oil to China priced in yuan?
- Settled entirely through BRICS Pay today
- Banned under BRICS membership rules
- Reported, but never officially confirmed
- Confirmed as the standard since 2023
Reveal Answer
Answer: C. Section 2.6: BRICS and the Challenge to Dollar Dominance treats yuan-priced Saudi oil sales as reports that have not been officially confirmed.
2. Since July 2022, what has the RBI allowed for India’s foreign trade?
- Paying for all oil imports in gold only
- Replacing the dollar with a BRICS currency unit
- Settling trade only through SWIFT in euros
- Invoicing and settling trade in rupees
Reveal Answer
Answer: D. An RBI circular of July 11, 2022, set up an arrangement to invoice, pay and settle exports and imports in rupees.
3. How did the dollar’s share of global reserves change between 2000 and 2024, according to Section 2.6: BRICS and the Challenge to Dollar Dominance?
- From about 71% to about 58%
- From about 58% to about 71%
- From about 40% to about 30%
- From about 89% to about 40%
Reveal Answer
Answer: A. The share fell from roughly 71% to roughly 58%: a real decline that still leaves the dollar dominant.
4. Which statement best describes India’s stance on de-dollarization?
- India has pegged the rupee to the yuan
- Cautious: replacing the dollar is not its policy
- India has stopped holding US dollar reserves
- India leads the push for a single BRICS currency
Reveal Answer
Answer: B. Section 2.6: BRICS and the Challenge to Dollar Dominance notes India has publicly said a stable dollar supports global stability and replacing it is not its policy.
5. Worked problem: The dollar’s share of a group’s reserves fell from 70% to 58%. By how many points and what relative percentage?
Reveal Answer
Answer: Points = 12. Relative fall = 1 − 58 ÷ 70 = 17.1%.
6. Worked problem: If the group’s reserves are $4tn, how many dollars does that 12-point fall represent?
Reveal Answer
Answer: 12% × $4tn = $0.48tn moved into other assets.
2.7 US Stock Market Indices
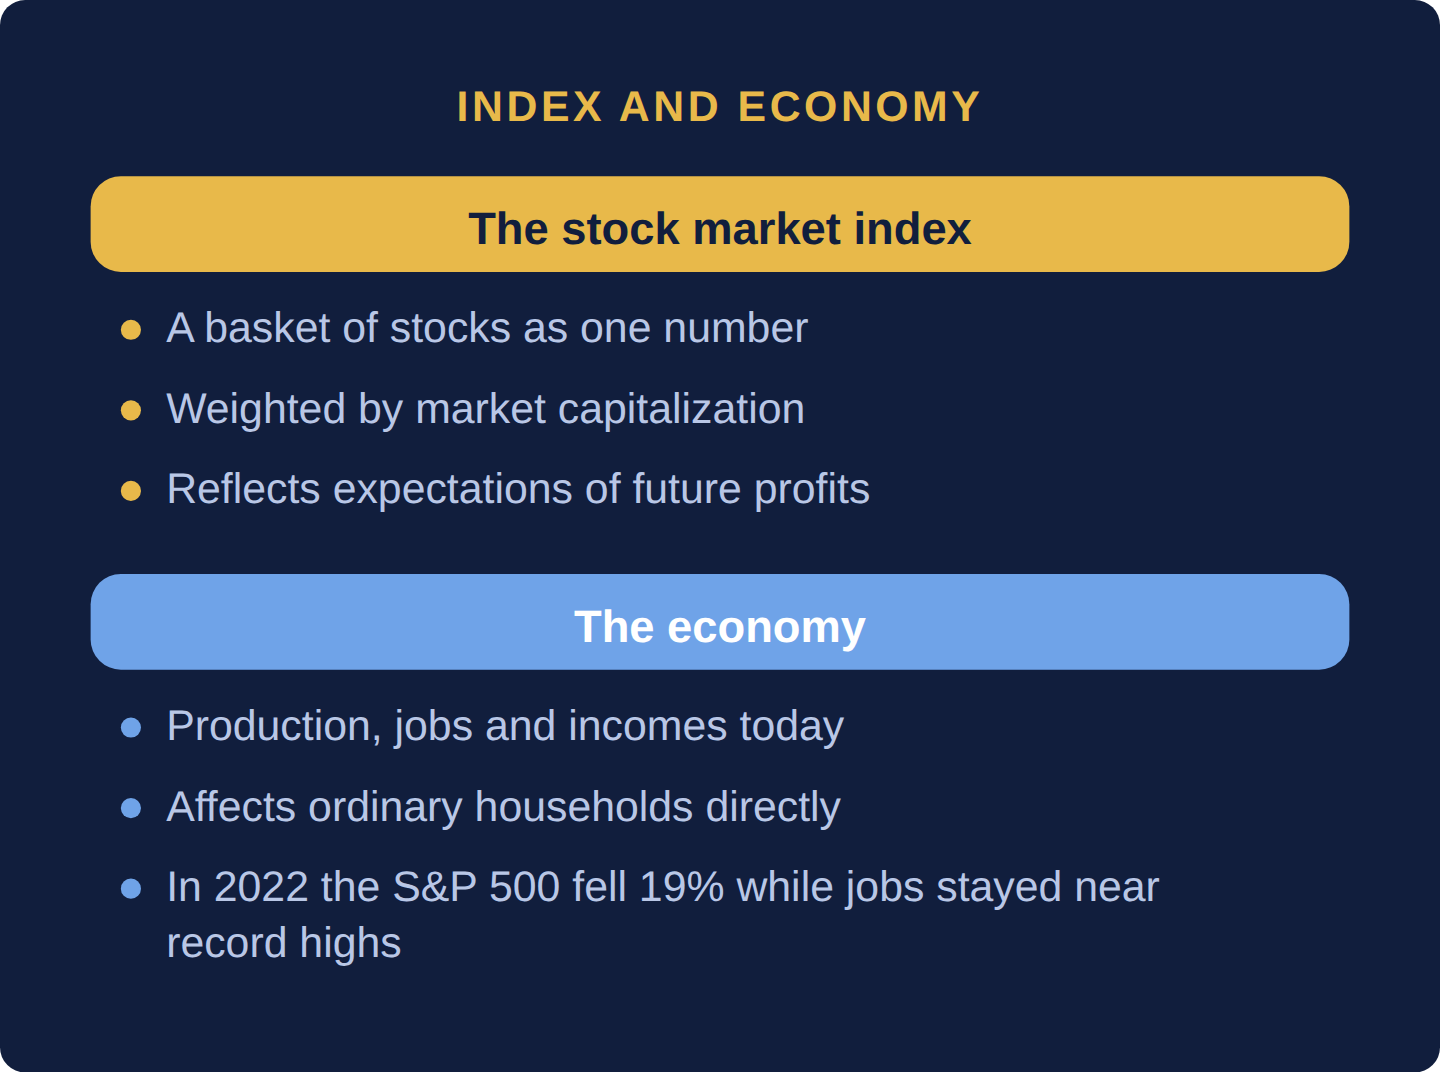
A stock market index tracks a basket of stocks as one number, and most weight companies by market capitalization. The stock market is not the economy: an index reflects expectations about future corporate profits, not how ordinary people are doing today.
Why it matters: A rising index and a struggling economy can exist at the same time.
Summary: A stock market index tracks a basket of stocks as a single number, and most weight companies by market capitalization. The stock market is not the economy.
- The S&P 500 can rise 20% in a year while millions of ordinary people struggle financially, because the index reflects expectations about future corporate profits.
- In 2022 the S&P 500 fell 19% even as US employment stayed near record highs.
A stock market index tracks a basket of stocks together as a single number, allowing people to discuss “how the market is doing” without listing every individual company’s performance. Indices are constructed according to specific methodologies — most weight companies by their market capitalization.
How an index is built
An index needs two choices: which stocks go in, and how much each one counts. Most major indexes weight each company by its market capitalization, which is share price times shares outstanding. The S&P 500 and India’s Nifty 50 use free-float market capitalization, which counts only the shares available to the public. A few indexes, such as the Dow Jones Industrial Average, weight by share price instead, so a high-priced share moves the index more than a bigger company with a lower price.
Why the weights matter
In a market-capitalization-weighted index the largest companies move the number most. That is why a handful of very large firms can drive an index on their own, and why an index can rise even when most of its stocks fall.
Three companies have market capitalizations of $500 billion, $300 billion and $200 billion. Over a month, A rises 10%, B falls 5% and C is unchanged.
| Company | Market cap | Weight | Move | Contribution |
|---|---|---|---|---|
| A | $500 billion | 50% | +10% | +5.0 points |
| B | $300 billion | 30% | −5% | −1.5 points |
| C | $200 billion | 20% | 0% | 0.0 points |
| Index | $1,000 billion | 100% | +3.5% |
Result: weighting by market capitalization gives +3.5%. Now suppose the same three shares trade at $100, $50 and $20 and the index is price-weighted. The same moves give (110 + 47.5 + 20) ÷ 170 − 1 = +4.4%. Same stocks, same moves, a different index.
| Index | What It Tracks | Companies | Why It Matters |
|---|---|---|---|
| S&P 500 | 500 large US companies across most industries | 500 | The most widely used benchmark for US equities; what most fund managers are measured against |
| Dow Jones (DJIA) | 30 major US blue-chip companies (large, long-established, financially solid firms) | 30 | The oldest (1896) and most famous index; price-weighted rather than market-cap weighted; narrower than S&P 500 |
| Nasdaq Composite | All companies listed on the Nasdaq exchange | 3,000+ | Heavily weighted toward technology; the benchmark for tech sector performance |
| Nasdaq-100 | 100 largest non-financial Nasdaq companies | 100 | Underlying index for the QQQ ETF; even more tech-concentrated than Nasdaq Composite |
| Russell 2000 | 2,000 small US companies | 2,000 | The benchmark for small-cap US stocks; signals how the broader, non-mega-cap economy is performing |
It is a common and consequential mix-up: the stock market is not the economy. The S&P 500 can rise 20% in a year while millions of ordinary people struggle financially, because the index reflects investors’ expectations about future corporate profits — driven by factors (technology adoption, interest rate changes, global trade flows) that may be disconnected from how ordinary households are actually doing. Always distinguish between market performance and economic welfare. The 2022 example is instructive: the S&P 500 fell 19% even as US employment remained near record highs — market and economy moving in opposite directions simultaneously.
What is a stock market index?
A basket of stocks tracked as a single number, usually weighted by each company’s market capitalization.
Is the stock market the economy?
No. The S&P 500 can rise 20% in a year while millions of ordinary people struggle financially, because the index reflects expectations about future corporate profits.
Can stocks fall when the economy is strong?
Yes. In 2022 the S&P 500 fell 19% even as US employment stayed near record highs.
A stock market index tracks a basket of stocks as one number, mostly weighted by market capitalization. It reflects expectations about future profits, so it can rise while households struggle, as the S&P 500 did, and fall 19% in 2022 while employment stayed near record highs.
Four questions and two worked problems on this chapter. Decide on your answer first, then click “Reveal Answer.”
1. How is the Dow Jones Industrial Average weighted?
- By market capitalization
- Equally across all 30 stocks
- By each company’s revenue
- By share price
Reveal Answer
Answer: D. The Dow is price-weighted, unlike the market-cap-weighted S&P 500.
2. Which index is the standard benchmark for US small-cap stocks?
- Russell 2000
- Dow Jones Industrial Average
- Nasdaq-100
- S&P 500
Reveal Answer
Answer: A. The Russell 2000 tracks 2,000 small US companies.
3. In 2022 the S&P 500 fell 19% while US employment stayed near record highs. What does this illustrate?
- Rate hikes raise stock prices
- Employment data lag by a full year
- The stock market is not the economy
- Indices are price-weighted averages
Reveal Answer
Answer: C. Stock prices reflect expected future profits and interest rates, which can move apart from current economic conditions.
4. Which index underlies the QQQ ETF?
- Nasdaq-100
- Nasdaq Composite
- Russell 2000
- Dow Jones Industrial Average
Reveal Answer
Answer: A. Section 2.7: US Stock Market Indices identifies the Nasdaq-100, the 100 largest non-financial Nasdaq companies, as QQQ’s underlying index.
5. Worked problem: A cap-weighted index holds three firms worth $300bn, $200bn and $100bn. What are their weights?
Reveal Answer
Answer: Total $600bn: weights = 50%, 33.3% and 16.7%.
6. Worked problem: Over a month the firms move +10%, 0% and −6%. What does the index do?
Reveal Answer
Answer: Index move = 0.5 × 10% + 0.333 × 0% + 0.167 × (−6%) = 4.0%.
2.8 US Labor Market Data — The Numbers That Move Everything
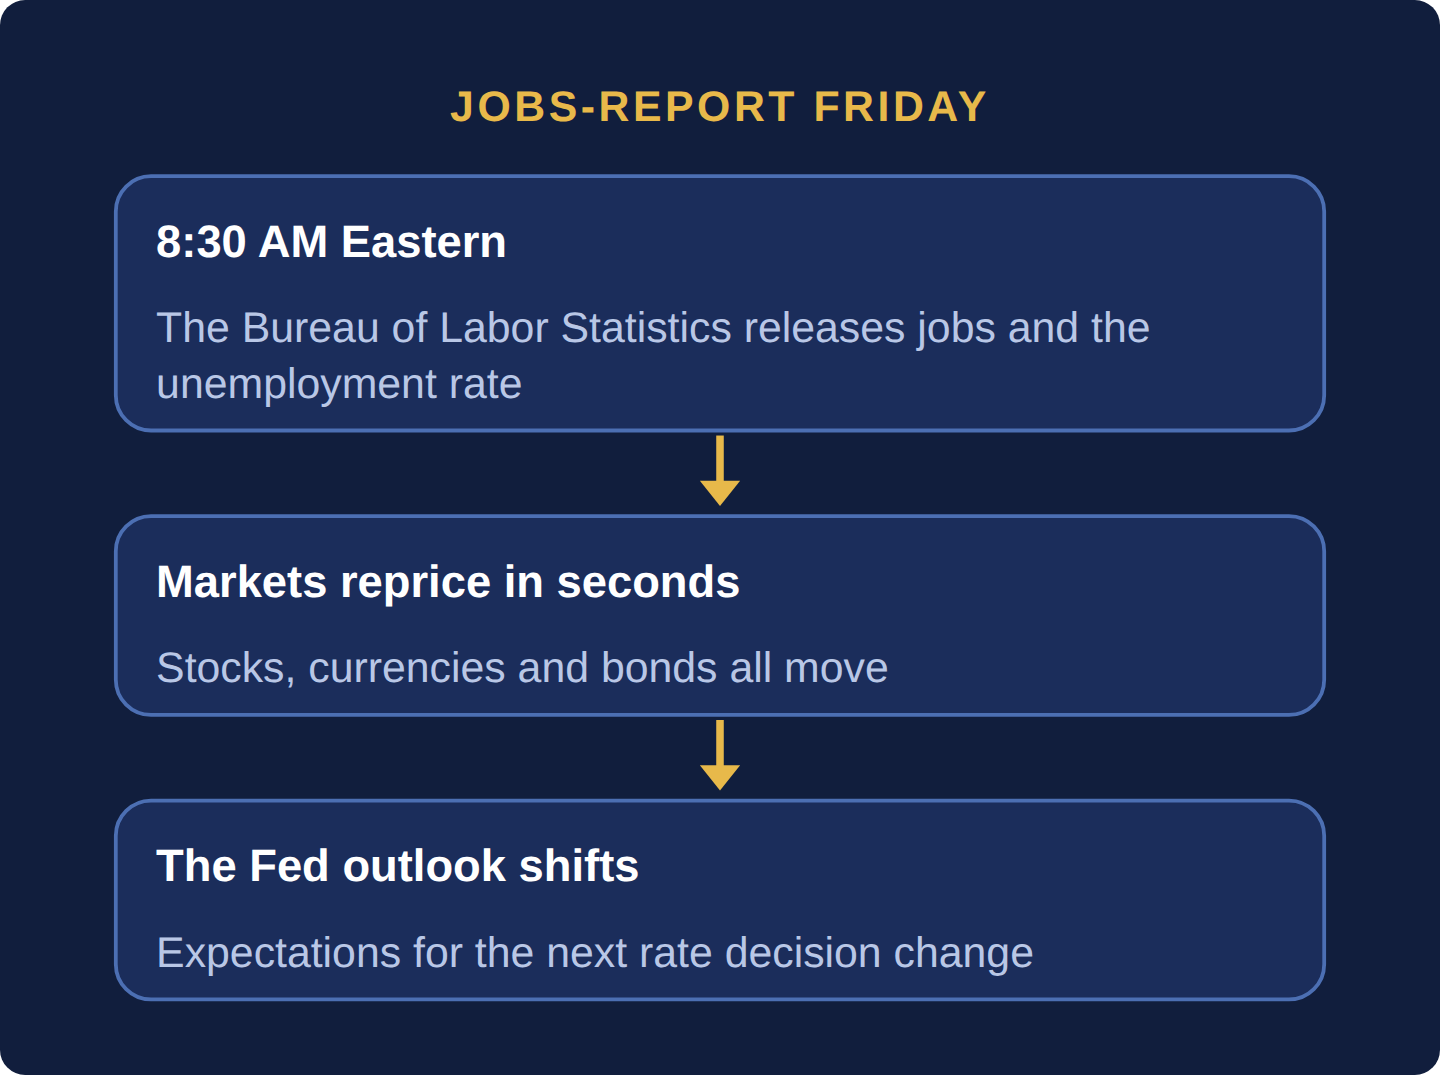
The Non-Farm Payrolls report counts the jobs the US economy added or lost the previous month. It comes out on the first Friday of each month, from the Bureau of Labor Statistics, and it routinely moves stock, currency and bond markets within seconds.
Why it matters: It shapes what the Federal Reserve is likely to do next with interest rates.
Summary: The Non-Farm Payrolls report, usually released on the first Friday of each month by the Bureau of Labor Statistics, counts the jobs the US economy added or lost the previous month and routinely moves stock, currency and bond markets within seconds.
- It is released at 8:30 AM Eastern Time alongside the official unemployment rate, and it shapes what the Federal Reserve is likely to do next with interest rates.
- A stronger-than-expected report can make the rupee fall and Indian bond yields rise in the same session; on NFP Friday trading volumes spike, spreads widen and reconciliation teams see elevated break volumes.
In the US, one monthly report matters more than almost any other economic release: the Non-Farm Payrolls (NFP) report, usually released on the first Friday of each month by the Bureau of Labor Statistics. It counts how many jobs the US economy added or lost in the previous month (excluding farm workers, whose employment is highly seasonal). It is released alongside the official unemployment rate.
This single report routinely moves stock markets, currency markets, and bond markets within seconds of its 8:30 AM Eastern Time release — because it directly shapes what the Federal Reserve is likely to do next with interest rates, which cascades into mortgage rates, business loan costs, currency values, and asset prices everywhere. A stronger-than-expected NFP report can cause the rupee to fall and Indian bond yields to rise within the same trading session.
What is in the report
The headline jobs number comes from a survey of employers, the establishment survey, which counts payroll jobs. The unemployment rate published alongside it comes from a separate survey of households. The two can point in different directions in the same month, because they count different things.
Why the first number is not final
The first estimate is revised in each of the following two months as late responses arrive, so a single month is noisy. Many analysts therefore look at the three-month average rather than at one release.
A forecast of +180,000 jobs meets a first estimate of +120,000. The two previous months are revised: the first from +150,000 to +170,000 and the second from +170,000 to +160,000.
| Step | Calculation | Result |
|---|---|---|
| 1. Miss against forecast | 120,000 − 180,000 | −60,000 |
| 2. Net revision to prior months | (170,000 − 150,000) + (160,000 − 170,000) | +10,000 |
| 3. Three-month average | (170,000 + 160,000 + 120,000) ÷ 3 | 150,000 |
Result: the headline missed by 60,000, but revisions added a net 10,000 and the three-month average is 150,000: a slowing trend, not a collapse. Markets react to the first number, while the trend is the better guide.
| Report | What It Measures | Released |
|---|---|---|
| Non-Farm Payrolls (NFP) | Total jobs added or lost in the US economy (excluding agriculture) — the single most market-moving data release globally | First Friday of each month, 8:30 AM ET |
| ADP Employment Report | Private-sector jobs estimate — often seen as a preview of NFP | Wednesday before NFP Friday |
| Initial Jobless Claims | New unemployment benefit applications filed each week — a real-time economic health gauge | Every Thursday, 8:30 AM ET |
| JOLTS Report | Job Openings and Labor Turnover Survey — how many job openings exist and how many workers are quitting (quit rate is a measure of worker confidence) | ~5 weeks after month end |
For anyone working in capital markets operations, trading, risk management, or client services at a financial institution, NFP Friday is a live event. Trading volumes spike, spreads widen, systems come under pressure, and reconciliation teams deal with elevated break volumes from the volatility. Understanding what the number means — and why a surprise print in either direction causes the market reaction it does — is the difference between watching the chaos and understanding it.
What is the Non-Farm Payrolls report?
A monthly count of the jobs the US economy added or lost the previous month, published by the Bureau of Labor Statistics.
When is the jobs report released?
Usually on the first Friday of each month at 8:30 AM Eastern Time, alongside the official unemployment rate.
Why does the jobs report move markets?
It shapes what the Fed is likely to do next with interest rates. A stronger-than-expected report can make the rupee fall and Indian bond yields rise in the same session.
What happens in operations on jobs-report Friday?
Trading volumes spike, spreads widen and reconciliation teams see elevated break volumes.
The Non-Farm Payrolls report counts jobs added or lost the previous month and is released at 8:30 AM Eastern on the first Friday of the month with the unemployment rate. It moves stock, currency and bond markets within seconds because it shapes what the Fed does next.
Four questions and two worked problems on this chapter. Decide on your answer first, then click “Reveal Answer.”
1. When is the Non-Farm Payrolls report usually released?
- The Wednesday before month end, at noon
- First Friday of the month, 8:30 AM ET
- About ten days after month end
- Every Thursday, 8:30 AM ET
Reveal Answer
Answer: B. NFP comes out on the first Friday of each month at 8:30 AM Eastern; jobless claims come every Thursday.
2. Why does NFP exclude farm workers?
- Farm jobs are measured only every ten years
- Farm workers are counted in JOLTS instead
- Farm wages are set by the government
- Farm employment is highly seasonal
Reveal Answer
Answer: D. Section 2.8: US Labor Market Data — The Numbers That Move Everything notes that farm employment swings with the seasons and would cloud the monthly signal.
3. A much stronger-than-expected NFP print arrives. Why might Indian bond yields rise the same day?
- US payroll taxes are collected and paid in rupees
- Indian banks lose their reserve requirements that day
- Markets expect the Fed to keep rates higher for longer
- The RBI must match US job growth under Indian law
Reveal Answer
Answer: C. Strong jobs data shift expectations of Fed policy, which moves US yields, the dollar and capital flows that reach Indian markets.
4. Which release measures job openings and how many workers quit?
- Initial Jobless Claims
- JOLTS
- Non-Farm Payrolls
- ADP Employment Report
Reveal Answer
Answer: B. The Job Openings and Labor Turnover Survey reports openings and quits; the quit rate signals worker confidence.
5. Worked problem: The consensus for payrolls was 150,000 and the report shows 95,000. What is the miss?
Reveal Answer
Answer: 95,000 − 150,000 = −55,000.
6. Worked problem: The previous two months were 180,000 and 160,000. What is the three-month average including 95,000?
Reveal Answer
Answer: (180,000 + 160,000 + 95,000) ÷ 3 = 145,000.
2.9 Bonds and the Yield Curve — The Market That Rules Them All
Bond prices and yields move in opposite directions. The yield curve normally slopes upward, and when it inverts it has preceded essentially every US recession of the past half-century, though not on a fixed schedule. The 10-year Treasury yield is the world’s benchmark rate.
Why it matters: Mortgage rates, corporate borrowing costs and emerging-market capital flows all key off it.
Summary: Bond prices and yields move in opposite directions, the yield curve normally slopes upward, and its inversion has preceded essentially every US recession in the past half-century, though not on a fixed schedule. The 10-year Treasury yield is the world’s benchmark rate.
- If you hold a bond paying 5% and new bonds pay 7%, its price falls until its effective return matches the market, the mechanism that broke Silicon Valley Bank.
- The 2022–24 inversion was the deepest in four decades, yet a recession, unusually, did not promptly arrive.
- US mortgages price off the 10-year Treasury yield, global corporations borrow at spreads above it, and emerging markets feel capital flee toward it whenever it rises.
- In the UK in September 2022, collateral calls on pension LDI funds forced gilt sales that pushed yields higher until the Bank of England stepped in.
A bond is a loan you can buy and sell. The bond market is bigger than the stock market, and the interest rate on US government bonds — Treasuries — is the reference price for money worldwide, anchoring everything from Indian corporate borrowing to your home loan. When people say “the market” disciplines governments, they mean the bond market.
A bond is an IOU: the issuer (a government or company) borrows your money, pays fixed interest — the coupon — and repays the principal at maturity. Unlike a bank loan, a bond trades hands constantly after issuance, and its market price moves. This produces the single most important mechanical rule in finance: bond prices and yields move in opposite directions. If you hold a bond paying 5% and new bonds pay 7%, nobody buys yours at full price — its price falls until its effective return (yield) matches the market. Rates up, bond prices down; rates down, bond prices up. This is precisely the mechanism that broke Silicon Valley Bank (chapter 3.9: Bank Regulation — and the SVB Case Study): rising rates crushed the value of its bond holdings.
Bond safety spans a spectrum. Government bonds (US Treasuries, India’s G-Secs) are the safest in their own currency, since governments can tax — or print. Investment-grade corporate bonds pay more to compensate for default risk; high-yield (“junk”) bonds pay much more for much more risk. The gap between a corporate bond’s yield and the equivalent government yield — the credit spread — is a real-time fear gauge: spreads widen when markets smell trouble.
Plot government bond yields from 3-month to 30-year maturities and you get the yield curve — arguably the most watched line in finance. Normally it slopes upward: lenders demand more for locking money away longer. When it inverts — short-term yields above long-term — markets are effectively saying “rates are high now, but a slowdown will force cuts.” An inverted US curve has preceded essentially every US recession in the past half-century, which is why the 2022–24 inversion, the deepest in four decades, generated so much anxiety (a recession that, unusually, did not promptly arrive — a reminder that even the best indicator is a probability, not a prophecy).

Think of the yield curve as the price list at a lending shop: borrowing for 30 years should cost more than borrowing for 3 months, the way a 30-day car rental costs more than a 3-day one. When the 3-day rental suddenly costs more than the 30-day one, the shop is telling you something strange: it expects prices to collapse soon. That’s an inverted yield curve — the market betting that hard times will force interest rates down.
Why does this market “rule them all”? Because the 10-year US Treasury yield is the world’s risk-free benchmark: US mortgages price off it, global corporations borrow at spreads above it, equity valuations discount future profits against it, and emerging markets feel capital flee toward it whenever it rises. And because bond investors can sell a government’s debt — driving its borrowing costs up — they discipline fiscal policy in a way voters rarely do. The UK’s 2022 mini-budget crisis, when markets revolted against unfunded tax cuts and a prime minister fell within weeks, showed that muscle, and also how leverage can turn a repricing into a spiral (see the box below). India’s own G-Sec market has joined the global mainstream: Indian government bonds entered JPMorgan’s flagship emerging-market bond index in June 2024, pulling tens of billions of dollars of foreign inflows into rupee debt.
On September 23, 2022, the UK government announced a package of fiscal measures, including unfunded tax cuts, and gilt yields jumped. Between August 1 and their peak on October 14, 30-year gilt yields rose more than 2.7 percentage points, briefly above 5%, a rise the Bank of England put at more than twice that of the March 2020 “dash for cash.” The damage spread through liability-driven investment (LDI) funds, which many UK defined-benefit pension schemes use to match the interest-rate sensitivity of the pensions they have promised, by holding long gilts and gilt derivatives partly with borrowed money.
Illustration (round numbers, not a real fund): a fund holds $400 million of long-gilt exposure on $100 million of the scheme’s cash. With a duration of about 20, a 1-percentage-point rise in yields cuts the exposure’s value by about $400 million × 20 × 0.01 = $80 million, and the fund’s lenders and derivative counterparties demand most of that as collateral within days. To raise cash, funds sold gilts; the sales pushed yields higher, which triggered more collateral calls: in the Bank of England’s words, “a vicious spiral of collateral calls and forced gilt sales.” The Bank broke the loop with temporary purchases of long-dated gilts from September 28 to October 14, 2022, giving funds time to rebuild their buffers. The lesson applies to every leveraged hedge: a position that is safe if you can hold it can still fail if you must post collateral before the market recovers (Sections 3.15 and 3.16).
Why do bond prices fall when yields rise?
If you hold a bond paying 5% and new bonds pay 7%, its price falls until its effective return matches the market.
What is an inverted yield curve?
A curve that slopes downward because short-term yields are above long-term yields. It has preceded essentially every US recession in the past half-century, though not on a fixed schedule.
Did the 2022–24 inversion predict a recession?
It was the deepest in four decades, yet a recession, unusually, did not promptly arrive.
Why is the 10-year Treasury yield so important?
US mortgages price off it, global corporations borrow at spreads above it, and emerging markets feel capital flee toward it whenever it rises.
Bond prices and yields move in opposite directions, the yield curve normally slopes upward and its inversion has preceded essentially every US recession in the past half-century, though not on a fixed schedule, and the 10-year Treasury yield is the world’s benchmark rate, including for US mortgages. Bond markets discipline governments, and leverage can amplify that discipline: in the UK in September 2022, collateral calls on pension LDI funds forced gilt sales that pushed yields still higher until the Bank of England stepped in.
Four questions and two worked problems on this chapter. Decide on your answer first, then click “Reveal Answer.”
1. You hold a bond paying 5% and new bonds now pay 7%. What happens to your bond’s price?
- It stays fixed at face value until maturity
- It rises because market rates went up
- It falls until its yield matches the market
- It is reset to pay 7% like the new bonds
Reveal Answer
Answer: C. Bond prices and yields move in opposite directions: the price falls until the bond’s effective yield matches new issues.
2. An illustrative LDI fund holds $400 million of long-gilt exposure with a duration of about 20. Roughly how much value does a 1-percentage-point rise in yields wipe out?
- About $80 million
- About $20 million
- About $8 million
- About $400 million
Reveal Answer
Answer: A. $400 million × 20 × 0.01 = $80 million, which is why lenders demanded collateral and funds were forced to sell gilts.
3. What turned the UK’s September 2022 gilt sell-off into a spiral?
- Foreign banks were cut off from dollar clearing
- UK banks refused to accept any gilt deposits
- The Bank of England raised reserve requirements
- Collateral calls forced LDI funds to sell gilts
Reveal Answer
Answer: D. Rising yields triggered collateral calls; the funds sold gilts to meet them, pushing yields higher and triggering more calls until the Bank of England bought long gilts.
4. What does an inverted yield curve mean?
- Bond prices and yields move in the same direction
- Corporate yields are below government yields
- Long-term yields are far above short-term yields
- Short-term yields are above long-term yields
Reveal Answer
Answer: D. Inversion means short rates exceed long rates, often read as markets expecting a slowdown that forces rate cuts.
5. Worked problem: A two-year bond pays a 5% annual coupon on $1,000. Market yields are 7%. What is its price?
Reveal Answer
Answer: Price = $50 ÷ 1.07 + $1,050 ÷ 1.07² = $963.84, a discount because the coupon is below the yield.
6. Worked problem: The 2-year yield is 4.9% and the 10-year yield is 4.5%. What is the spread, and what is the curve called?
Reveal Answer
Answer: Spread = 4.5 − 4.9 = −0.4 points: an inverted yield curve.
- RBI circular of July 11, 2022
- Bank of England, Financial Stability Report, December 2022 — LDI collateral-call spiral; 30-year gilt yields +270bp Aug 1–Oct 14, 2022; temporary gilt purchases
- Bank of England, gilt market operation, September 28, 2022