
- Rent vs Buy: Mortgage Types and the True Cost of a Home Loan (you are here)
- How Much House Can You Afford on $1,750 a Month in 2026
- 30-Year Fixed vs ARM: Which Mortgage Is Better? A 7/6 ARM Case
- Mortgage Refinance: Why Lenders Cannot Reprice Your Loan
Buying a home is not always better than renting. Compare the owner’s costs you can never get back, like interest, taxes and repairs, with the rent you would pay instead. Buying usually wins only if you stay past a break-even point, about seven years in this volume’s example. For a shorter stay, renting and investing the difference tends to come out ahead. Decide how much house you can afford from your own budget, not from what a lender will approve.
Why it matters: How long you plan to stay often matters more than the price of the house.
Summary: Buy only if you expect to stay past the break-even year, about seven years for this volume’s example home at the October 2026 average rate of 7.28%; for a shorter stay, renting and investing the difference usually wins. Size the loan by your own budget, not the lender’s approval, and judge a mortgage by its cost over the years you will hold it.
- Compare rent with the owner’s unrecoverable costs, not the mortgage payment (5.1: Rent vs Buy — Running the Real Numbers).
- 28% of gross income for housing is a ceiling, not a target (5.2).
- Get three quotes within 14 days: lenders’ offers in the same week typically scatter 0.15–0.25 point around the average (5.3).
- A 7/6 ARM pays only if you sell or refinance before about year eight, or rates settle near today’s (5.4).
Throughout this volume we follow a single filer earning $75,000 (net biweekly pay $2,163.60), whose budget supports a home of about $224,000 (5.2).
Renting is not “throwing money away,” and buying is not automatically building wealth — both are incomplete claims. A fair comparison prices out the full cost of each option, not just the headline monthly number:
- True cost of owning: mortgage principal and interest, property tax, homeowners insurance, private mortgage insurance if applicable (5.5), routine maintenance (commonly budgeted at 1%–2% of home value per year), and the opportunity cost of the down payment — what it could have earned invested elsewhere instead.
- True cost of renting: rent itself, renters insurance (far cheaper than homeowners insurance), and — critically — what the difference between renting and owning’s monthly cost could earn if actually invested rather than spent.
Home price appreciation is real over long horizons, but it is not guaranteed over any specific period, and it is only one part of the comparison — the version of “buying always wins” that ignores maintenance, transaction costs on both ends (typically 8%–10% of price combined between buying and eventually selling), and the opportunity cost of the down payment is not a complete analysis.
Set rent against the owner’s unrecoverable costs, the money that buys nothing you keep, not against the mortgage payment. Principal repaid is saving; it comes back when you sell. For the 5.2 home in year one (6.8%, 10% down): interest $13,643 + property tax $2,464 + insurance $1,560 + PMI $1,210 + maintenance $2,240 + the 5% the $22,400 down payment could have earned, $1,120 = $22,237, or 9.9% of the $224,000 price. Renting costs $1,600 × 12 + $15 × 12 = $19,380 (8.7%). Appreciation closes the gap: 3% × $224,000 = $6,720 in year one, cutting the owner’s net cost to $15,517, $3,863 a year below rent. Each point of price growth is worth $2,240 a year here.
That edge must first repay the transaction costs: $6,720 to buy plus 6% of the sale price after five years, $15,581 ($224,000 × 1.035 × 6%), $22,301 in all. Break-even ≈ $22,301 ÷ $3,863 ≈ 5.8 years. The edge widens as rent rises and interest falls, so the month-by-month model below breaks even a little sooner, at about five.
The real answer to “should I rent or buy” is almost always “it depends on how long you’ll stay.” Buying carries large fixed transaction costs (closing costs, agent commissions on the eventual sale) that only get diluted into a reasonable annualized cost over several years — a general rule of thumb is that renting is usually cheaper for a stay under roughly three to five years in a given home, while buying’s economics improve the longer the holding period extends beyond that.
Take the home 5.2 shows the $75,000 household can afford, rounded to $224,000, bought with 10% down ($22,400) and a $201,600 loan at 6.8% — against renting a comparable home for $1,600 a month. The assumptions, stated so you can change them: buying costs 3% of the price ($6,720) at closing and selling costs 6% of the sale price later (9% combined, inside the 8%–10% range above); the home’s value, rent, insurance, property tax and maintenance all rise 3% a year; maintenance is 1% of value a year; renters insurance is $15 a month; and whichever household has spare cash in a month invests it at 5% a year.
Month one, owning: principal and interest $1,314.28 + property tax $205.33 (1.1% × $224,000 ÷ 12) + insurance $130.00 + PMI $100.80 (0.6% × $201,600 ÷ 12) + maintenance $186.67 (1% × $224,000 ÷ 12) = $1,937.08. Month one, renting: $1,600 + $15 = $1,615.00. The renter keeps the $29,120 the buyer spent up front ($22,400 + $6,720) invested and adds the $322.08 monthly difference to it; in later years, whenever rent exceeds the owner’s costs, the owner invests the difference instead.
The comparison at each horizon is the owner’s net worth if the home were sold then (value minus 6% selling costs minus the loan balance, plus anything the owner invested) against the renter’s portfolio. Year-5 check: the home is worth $224,000 × 1.035 = $259,677; less 6% selling costs, $244,097; less the $189,358 loan balance, $54,739 — against $54,711 in the renter’s portfolio. In this example break-even lands at about five years, the top of the rule of thumb. The model leaves out income tax on both sides (the household takes the standard deduction, so the mortgage interest brings no tax benefit, and tax on the renter’s investment gains is ignored), a simplification that slightly flatters renting.
| Years in the home | Owner’s net worth after selling | Renter’s portfolio | Ahead |
|---|---|---|---|
| 1 | $17,400 | $34,500 | Renter, by $17,100 |
| 3 | $35,300 | $44,900 | Renter, by $9,600 |
| 5 | $54,700 | $54,700 | Even |
| 7 | $75,800 | $63,600 | Owner, by $12,100 |
| 10 | $111,600 | $75,100 | Owner, by $36,500 |
Try it yourself — Rent vs buy over your horizon
Defaults: a $400,000 home with 20% down at 7.28% for 30 years, against $2,400 a month in rent, over a 7-year stay.
- Net cost of buying, 7 years
- $222,014cash out − equity at sale + forgone return
- Net cost of renting, 7 years
- $220,679total rent paid
- Cheaper over 7 years
- Rentingby $1,335
- Break-even year
- Year 8first year buying’s net cost ≤ renting’s
- Mortgage payment
- $2,189.48principal and interest on $320,000
- Cash needed at closing
- $92,000$80,000 down + $12,000 closing costs
- Year-1 monthly cost to own
- $3,039payment + tax + insurance + maintenance, vs $2,400 rent
Exact formulas used
- Down payment D = price × down %; closing costs C = price × closing %; cash at closing U = D + C; loan L = price − D.
- Monthly payment M = L × j ÷ (1 − (1 + j)−n), with j = mortgage rate ÷ 12 and n = term × 12. Loan balance Bt comes from the month-by-month schedule.
- Home value at the end of year t: Vt = price × (1 + home price growth)t.
- Owning costs in year t = 12 × M (zero once the loan is paid off) + property tax % × Vt−1 + insurance × (1 + home price growth)t−1 + maintenance % × Vt−1.
- Cash out to own through year t = U + the owning costs of years 1 to t.
- Equity if sold at the end of year t = Vt × (1 − selling %) − Bt.
- Forgone return through year t = U × ((1 + return on money not spent)t − 1): what the cash at closing would have earned if you had rented and invested it.
- Net cost of buying = cash out − equity if sold + forgone return. Net cost of renting = the sum over years 1 to t of 12 × rent × (1 + rent increase)t−1.
- Break-even year = the first year t from 1 to 30 in which the net cost of buying ≤ the net cost of renting.
Not modeled: income taxes (including the mortgage-interest and property-tax deductions), PMI on loans with less than 20% down (5.5), renters insurance, HOA dues, and investing any month-to-month gap between owning and renting costs. When owning costs more each month, as it does at the default values, investing that gap would tilt the result further toward renting.
How to read this: Each side’s net cost is what the choice costs you by the end of your stay. For buying, that is every dollar paid out, minus what you would walk away with after selling, plus what the cash at closing could have earned invested. The lower net cost wins; the break-even year is the first year buying catches up. Try 3 years and then 12 to see how much the length of the stay matters.
A pre-tax simplification: income taxes are left out. The mortgage-interest deduction helps only if you itemize, and the 2026 standard deduction ($16,100 single, $32,200 married filing jointly) is larger than many households’ itemized total. Property tax, insurance and maintenance grow with the home’s value. Default mortgage rate: Freddie Mac PMMS 30-year fixed average, 7.28% as of Oct 1, 2026 (Freddie Mac). Illustration only, not advice.
The three-to-five-year rule summarizes typical inputs; it is not a law, and the break-even year moves a long way when any one input moves. Re-running the example with one change at a time: at the Oct 1, 2026 average rate of 7.28% instead of 6.8%, break-even moves from year 5 to year 7; if home values, rents and owning costs all rise 2% a year instead of 3%, to year 10; if none of them rises at all, owning does not catch up within 30 years; if comparable rent is $1,500 rather than $1,600, to year 7. In the other direction, at a 6% mortgage rate the owner pulls ahead in year 4.
The rule therefore fails most when mortgage rates are high, as in October 2026, when local prices are high relative to rents, and in slowly appreciating markets — and it is too cautious where homes are cheap relative to rent. Run the numbers with your own local rent, price and rate, and treat a planned stay of under about five years as a reason for caution rather than a green light.
The standard view: owning builds wealth. In the Federal Reserve’s 2022 Survey of Consumer Finances, homeowners’ median net worth was $396,200, renters’ $10,400. Its assumptions: that the gap comes from owning itself, through leverage and a payment that forces saving. The alternative: the survey compares different households, not one household renting and then owning, so it cannot show how much buying adds. What the evidence says: across 16 advanced economies from 1870 to 2015, Jordà, Knoll, Kuvshinov, Schularick and Taylor (NBER Working Paper 24112, revised 2019) found housing’s total real return close to equities’, about 7% a year with far less volatility, but real price gains of only about 1% a year; most of the return is the rent a home yields, which for an owner is rent not paid. What remains open: whether renters actually invest the difference; the survey gap fits both readings.
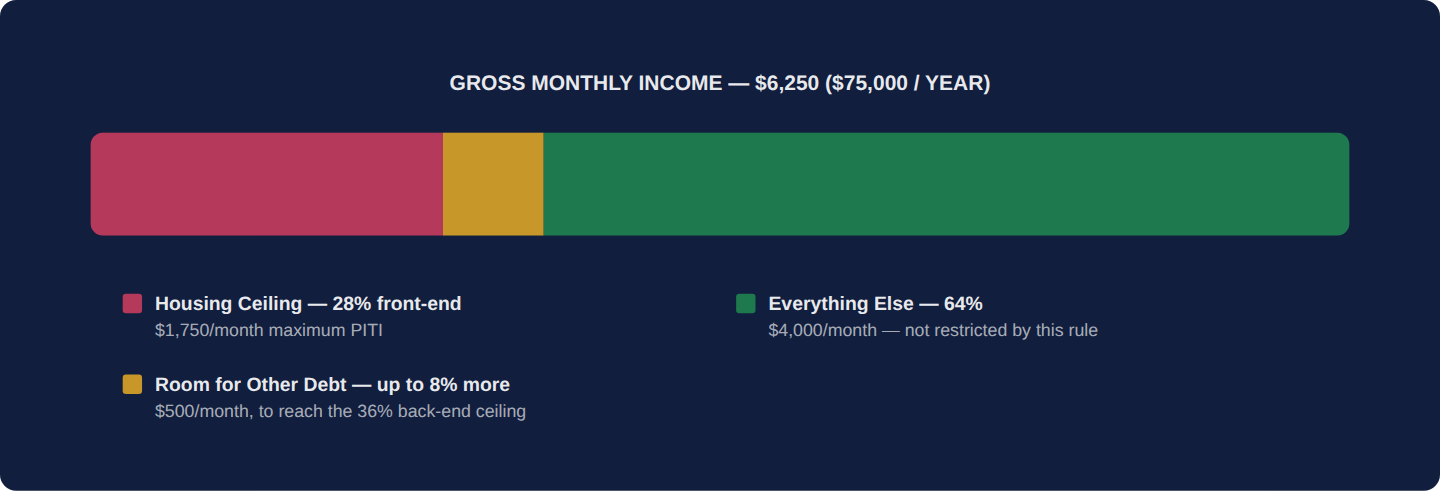
Lenders (and good household budgeting) lean on a long-standing framework: the 28/36 rule. No more than 28% of gross monthly income should go toward housing costs (principal, interest, taxes, insurance — “PITI”), and no more than 36% toward all debt payments combined, housing included.
Three questions on this chapter. Decide on your answer first, then click “Reveal Answer.”
1. A couple expects to relocate for work in about three years and is weighing buying at October 2026 mortgage rates near 7.28%. What does the volume’s rent-versus-buy analysis point to?
- Buying, since rent is thrown away while a mortgage builds equity
- Whichever has the lower first-month cost, as that sets the total
- Renting, as buying’s transaction costs have too little time to dilute
- Buying, provided the home appreciates at any rate over three years
Reveal Answer
Answer: C. Buying’s large fixed transaction costs dilute only over several years, so renting is usually cheaper for stays under about three to five years, and high rates push break-even later (to year 7 at 7.28% in the example). (Part 5.1: Rent vs Buy — Running the Real Numbers)
2. A $300,000 home has unrecoverable owning costs of $27,000 a year, comparable rent is $24,000, and the home appreciates 3% a year. Buying and later selling costs $27,000 in all. Roughly when does owning break even?
- After about 9 years
- After about 1.1 years
- After about 4.5 years
- Never, because owning costs more than rent
Reveal Answer
Answer: C. Appreciation is 3% × $300,000 = $9,000, so owning nets $27,000 − $9,000 = $18,000 a year, $6,000 less than rent; break-even ≈ $27,000 ÷ $6,000 = 4.5 years. Ignoring appreciation makes owning look permanently costlier; dividing the $27,000 of transaction costs by the $3,000 gap between owning costs and rent, as if it were a saving, gives 9. (Part 5.1: Rent vs Buy — Running the Real Numbers)
3. Worked problem: Closing costs are 4% of a $400,000 price, and owning saves $250 a month versus renting. What is the break-even time?
Reveal Answer
Answer: Closing costs = $16,000. Break-even = $16,000 ÷ $250 = 64 months (5.3 years).
- 2026 FHA loan limits — FHA floor and ceiling
- Regulation X §1024.17: escrow accounts — Escrow cushion
- What is a Loan Estimate? — Three-business-day delivery (5.3, A.1)
- What is a Closing Disclosure? — Three-business-day review (5.3, A.1)
- Conforming loan limit values for 2026 — 2026 conforming limits
- Removing private mortgage insurance — Homeowners Protection Act