
3.5 Why an Inverted Yield Curve Predicts Recession — The Math
Normally, borrowing for longer costs more. An inverted yield curve flips that, with short-term rates above long-term ones. That means markets expect rate cuts ahead, and rate cuts usually arrive when the economy is slowing. Inversions have come before every US recession since the 1980s, by roughly 8 to 17 months. But the 2022–24 inversion, the longest and among the deepest on record, was not followed by a recession as of October 2026.
Why it matters: Treat the curve as a warning light with no fixed timetable.
Summary: An inverted curve means markets price future rate cuts, which usually come with a slowing economy, so inversions have preceded every US recession since the 1980s by roughly 8 to 17 months. The 2022–24 inversion, the longest and among the deepest on record, was not followed by a recession as of October 2026, so the curve is a probability signal, not a schedule.
- The 10-year minus 3-month spread was inverted from October 2022 to December 2024 without an NBER-dated recession.
- The New York Fed’s model put the 12-month recession probability near 71% for May 2024; GDP grew about 3% in 2023 and 2024.
- Research disagrees on which spread matters and whether low term premia weaken the signal.
- Past recessions began after the curve re-steepened; watch that step and a second confirming signal.
- Selling stocks on the 2022 inversion missed a 46% rise in the S&P 500 before the curve turned positive.
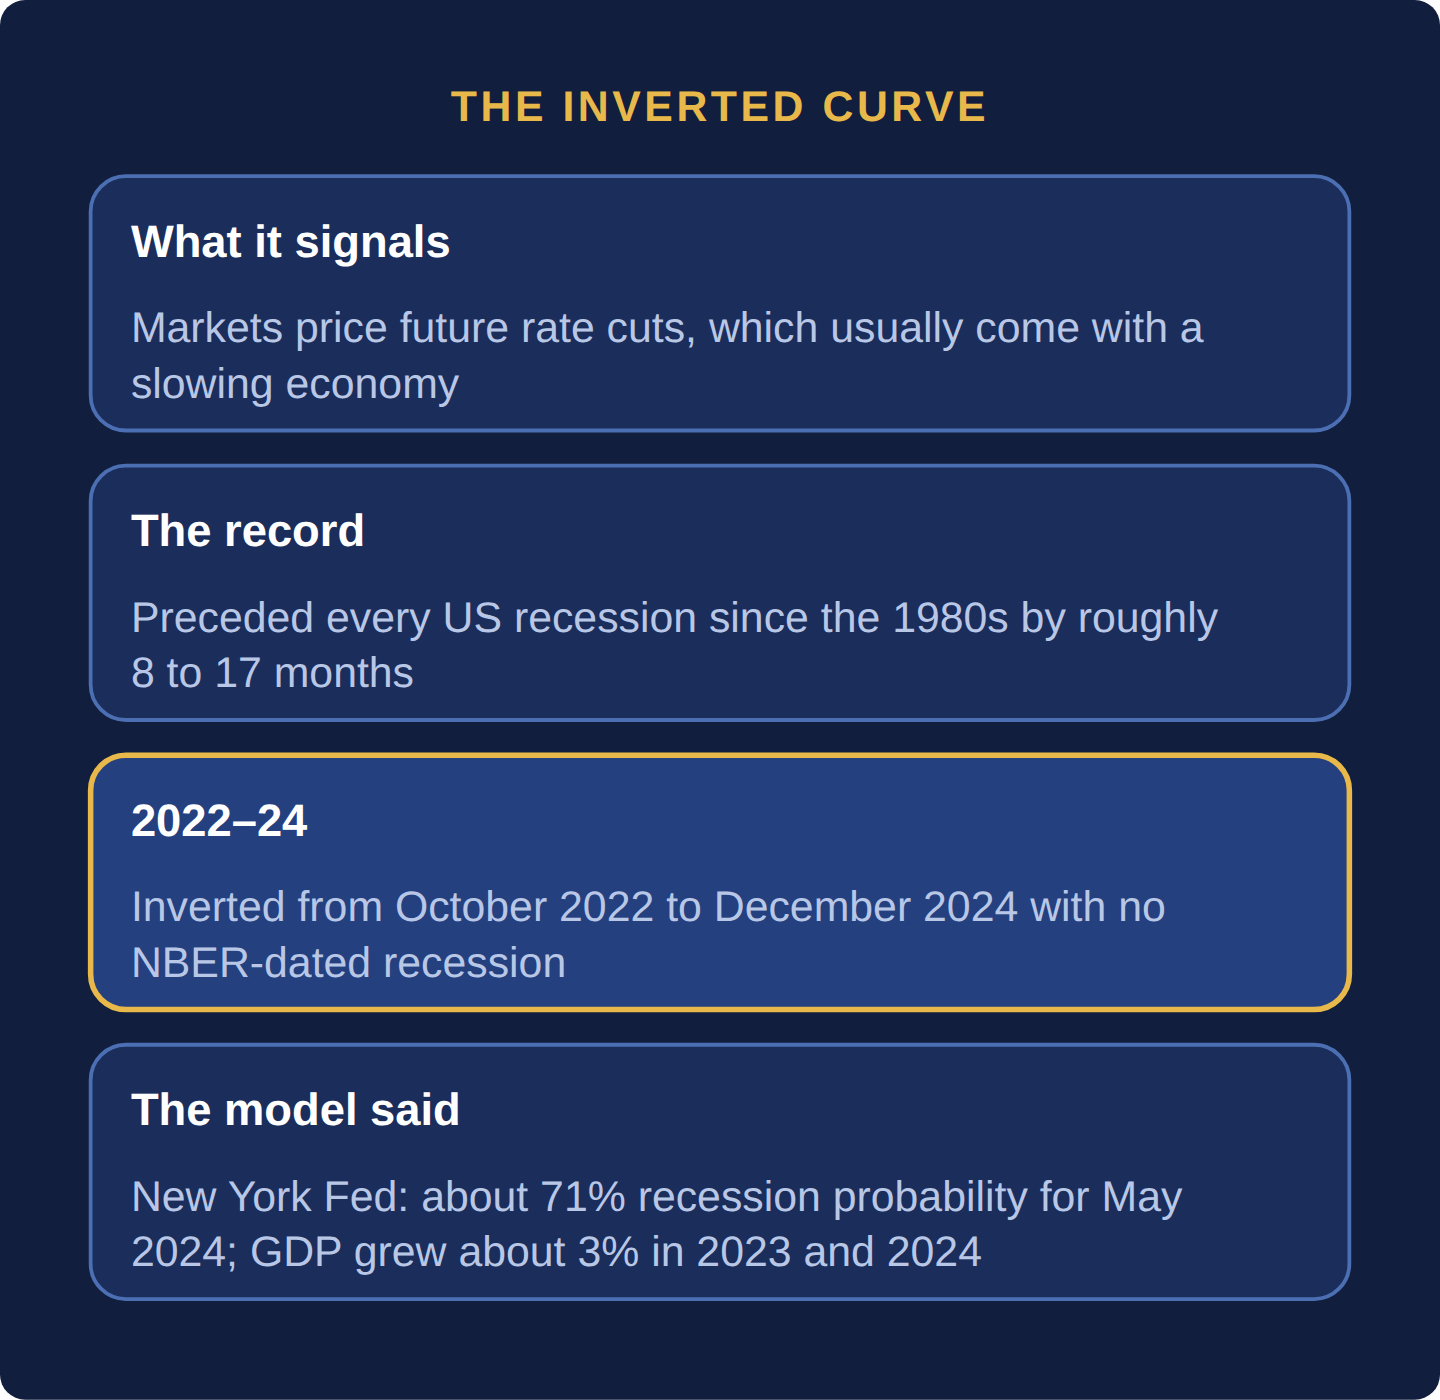
Volume I, Part 2 noted that an inverted yield curve (short-term yields higher than long-term yields) has preceded nearly every modern US recession, and that the 2022–24 inversion was not followed by one on the usual timetable. The mathematics behind that signal: an inversion means the market’s forward rates — the implied path of future short-term rates, plus a term premium (Section 3.4: The Yield Curve, Mathematically — Spot Rates and Forward Rates) — are falling, not rising. Since short-term rates are set primarily by the central bank (Volume I’s Part 2), a market pricing in falling short-term rates in the future is collectively betting that the central bank will need to cut rates — which central banks typically only do in response to a weakening economy.
An inversion is, in effect, the aggregated forecast of every bond investor in the market saying the same thing simultaneously: growth and inflation are expected to slow enough that policy easing will be required. That collective, capital-backed bet is why the signal has a strong record. It is still a probability, not a schedule: the bet can be wrong, or it can change the behavior that would have produced the recession.
Persistent inversions (20 or more trading days) of the 10-year minus 3-month Treasury spread since 1982, against business-cycle peaks dated by the National Bureau of Economic Research (NBER):
| Inversion began | Curve re-steepened | NBER peak | Months from inversion to peak |
|---|---|---|---|
| May 1989 | August 1989 | July 1990 | 14 |
| July 2000 | January 2001 | March 2001 | 8 |
| July 2006 | May 2007 | December 2007 | 17 |
| May 2019 | October 2019 | February 2020 (pandemic) | 9 |
| October 2022 | December 2024 | None dated as of October 2026 | 48 and counting |
The 2022–24 episode was the longest signal on record and the clearest miss. The 10-year minus 2-year spread was negative from July 6, 2022, to August 26, 2024, reaching −1.08 points on July 3, 2023, its deepest since 1981. The 10-year minus 3-month spread stayed inverted from October 25, 2022, to December 12, 2024 (534 trading days, the longest run since 1982). The New York Fed’s model put the probability of recession by May 2024 at about 71%. Instead, real GDP grew 2.9% in 2023, 3.0% in 2024 and 2.3% in 2025, unemployment peaked at 4.5% in November 2025, and the NBER’s latest peak is still February 2020. Every earlier recession began after the curve re-steepened; the 2024 re-steepening has not been followed by one.
The case for. Estrella and Mishkin (New York Fed, 1996) found the 10-year minus 3-month spread “significantly outperforms other financial and macroeconomic indicators in predicting recessions two to six quarters ahead.” Bauer and Mertens (San Francisco Fed, 2018) found every common spread informative, the 10-year minus 3-month slightly best, and “no clear evidence in the data that ‘this time is different’.”
The case against the usual spreads. Engstrom and Sharpe at the Federal Reserve Board (2018, reprised March 2022) argue that the information sits in the near-term forward spread, the forward 3-month rate six quarters ahead minus today’s 3-month rate, and that “it is not valid to interpret inverted term spreads as independent measures of impending recession.” In March 2022 their spread was above 2 points while the 10-year minus 2-year was about 0.25. The BIS (September 2019) warned that unusually low term premia, partly from central-bank bond buying, can invert a curve without the usual growth signal.
After the miss. Campbell Harvey, described by NPR as the pioneer of the inverted-yield-curve indicator, offered a behavioral explanation in October 2024: firms saw the inversion, cut risk, and so made a serious recession less likely. That is plausible but hard to test. The evidence is thin by nature: there have been eight NBER recessions since 1969, too few to tell a broken signal from one unlucky draw.
Reading rule: treat an inversion as a higher probability of recession over the next 6 to 24 months, not as a date. Act only when a second, independent signal confirms it, such as rising unemployment or widening credit spreads (Section 3.6: Credit Spreads Decomposed), and watch the re-steepening, which came before every recession in the 1982–2020 record. Discount the signal when the near-term forward spread is still positive or a low term premium, not expected rate cuts, drives the inversion.
Selling risk assets the day the curve inverts. Selling the S&P 500 when the 10-year minus 2-year spread inverted on July 6, 2022 (close 3,845.08) meant missing its rise to 5,616.84 by August 26, 2024, the last day of the inversion: 5,616.84 ÷ 3,845.08 − 1 = 46.1%, before dividends (FRED SP500). Avoid it: adjust risk by degrees through position size and hedges, not an all-or-nothing exit.
Did the inverted yield curve predict a recession in 2023 or 2024?
It pointed to one, and none came. The New York Fed’s model put the 12-month probability near 71% for May 2024, yet real GDP grew about 3% in both 2023 and 2024, and as of October 2026 the NBER had dated no recession since 2020.
Which yield spread is the best recession indicator?
The 10-year minus 3-month spread has the longest research record and drives the New York Fed’s model; the 10-year minus 2-year is the most quoted; Federal Reserve Board economists prefer a near-term forward spread. Measured accuracy differs little, so how you read the spread matters more than which one you pick.
Is the yield curve inverted now?
No. On October 2, 2026, the 10-year minus 3-month spread was +1.09 points and the 10-year minus 2-year +0.45 points. FRED’s T10Y3M and T10Y2Y series update daily.
An inverted curve signals that markets expect rate cuts, and persistent inversions preceded the US recessions of 1990, 2001, 2007 and 2020 by 8 to 17 months. The 2022–24 inversion was the longest on record yet no NBER recession had followed as of October 2026, so read the curve as a probability that needs confirmation, not as a timetable.
Six questions on this chapter. Decide on your answer first, then click “Reveal Answer.”
1. What happened after the 2022–24 inversion of the US Treasury curve, as of October 2026?
- No NBER-dated recession had followed it
- The NBER dated a recession starting in 2023
- A recession began within six months, as usual
- The curve never actually inverted in that period
Reveal Answer
Answer: A. The 10-year minus 3-month spread was inverted from October 2022 to December 2024, yet real GDP grew about 3% in 2023 and 2024 and the NBER’s latest peak remains February 2020.
2. In the 1990, 2001, 2007 and 2020 episodes, when did the recession begin relative to the inversion?
- On the day the curve first inverted
- After the curve had re-steepened
- While the inversion was at its deepest
- Before the curve inverted at all
Reveal Answer
Answer: B. In each case the 10-year minus 3-month spread turned positive again before the NBER peak, which is why practitioners watch the re-steepening.
3. Which measure do Federal Reserve Board economists Engstrom and Sharpe argue carries the curve’s recession information?
- The 10-year minus 2-year spread
- The 30-year minus 10-year spread
- The corporate minus Treasury spread
- The near-term forward spread
Reveal Answer
Answer: D. They argue the forward 3-month rate six quarters ahead minus today’s 3-month rate reflects expected policy easing more cleanly than long-term spreads.
4. An investor sold an S&P 500 fund at 3,845.08 on the day the curve inverted in July 2022. The index was 5,616.84 on August 26, 2024, the last day of the inversion. What price gain was missed?
- About 32%
- About 18%
- About 46%
- About 68%
Reveal Answer
Answer: C. 5,616.84 ÷ 3,845.08 − 1 ≈ 46.1%, before dividends. Using the curve as an exit signal was costly in this episode.
5. Worked problem: The 10-year yield is 4.2% and the 3-month yield is 5.3%. What is the spread, and is the curve inverted?
Reveal Answer
Answer: Spread = 4.2 − 5.3 = −1.1 points: inverted.
6. Worked problem: A curve inverts in October 2022. If inversions have preceded recessions by 8 to 17 months, in which window would a recession start?
Reveal Answer
Answer: October 2022 + 8 months = June 2023; + 17 months = March 2024. That window passed with no NBER-dated recession, which is why the signal is a probability, not a certainty.
3.6 Credit Spreads Decomposed
A credit spread is the extra yield a company bond pays over a government bond. It pays you for three things: the risk the company won’t repay, the difficulty of selling the bond quickly, and the risk premium investors demand. Two tools measure it: the Z-spread for plain bonds, and the option-adjusted spread, or OAS, for bonds with built-in options. Past default losses explain only a small part of the spreads on investment-grade bonds.
Why it matters: Most of what you are paid for holding company bonds is not simply expected defaults.
Summary: A credit spread is the extra yield a bond pays over Treasuries for default risk, illiquidity and the risk premium investors demand. Measure it with the Z-spread for plain bonds and the option-adjusted spread (OAS) for bonds with embedded options; historical default losses explain only a small part of investment-grade spreads.
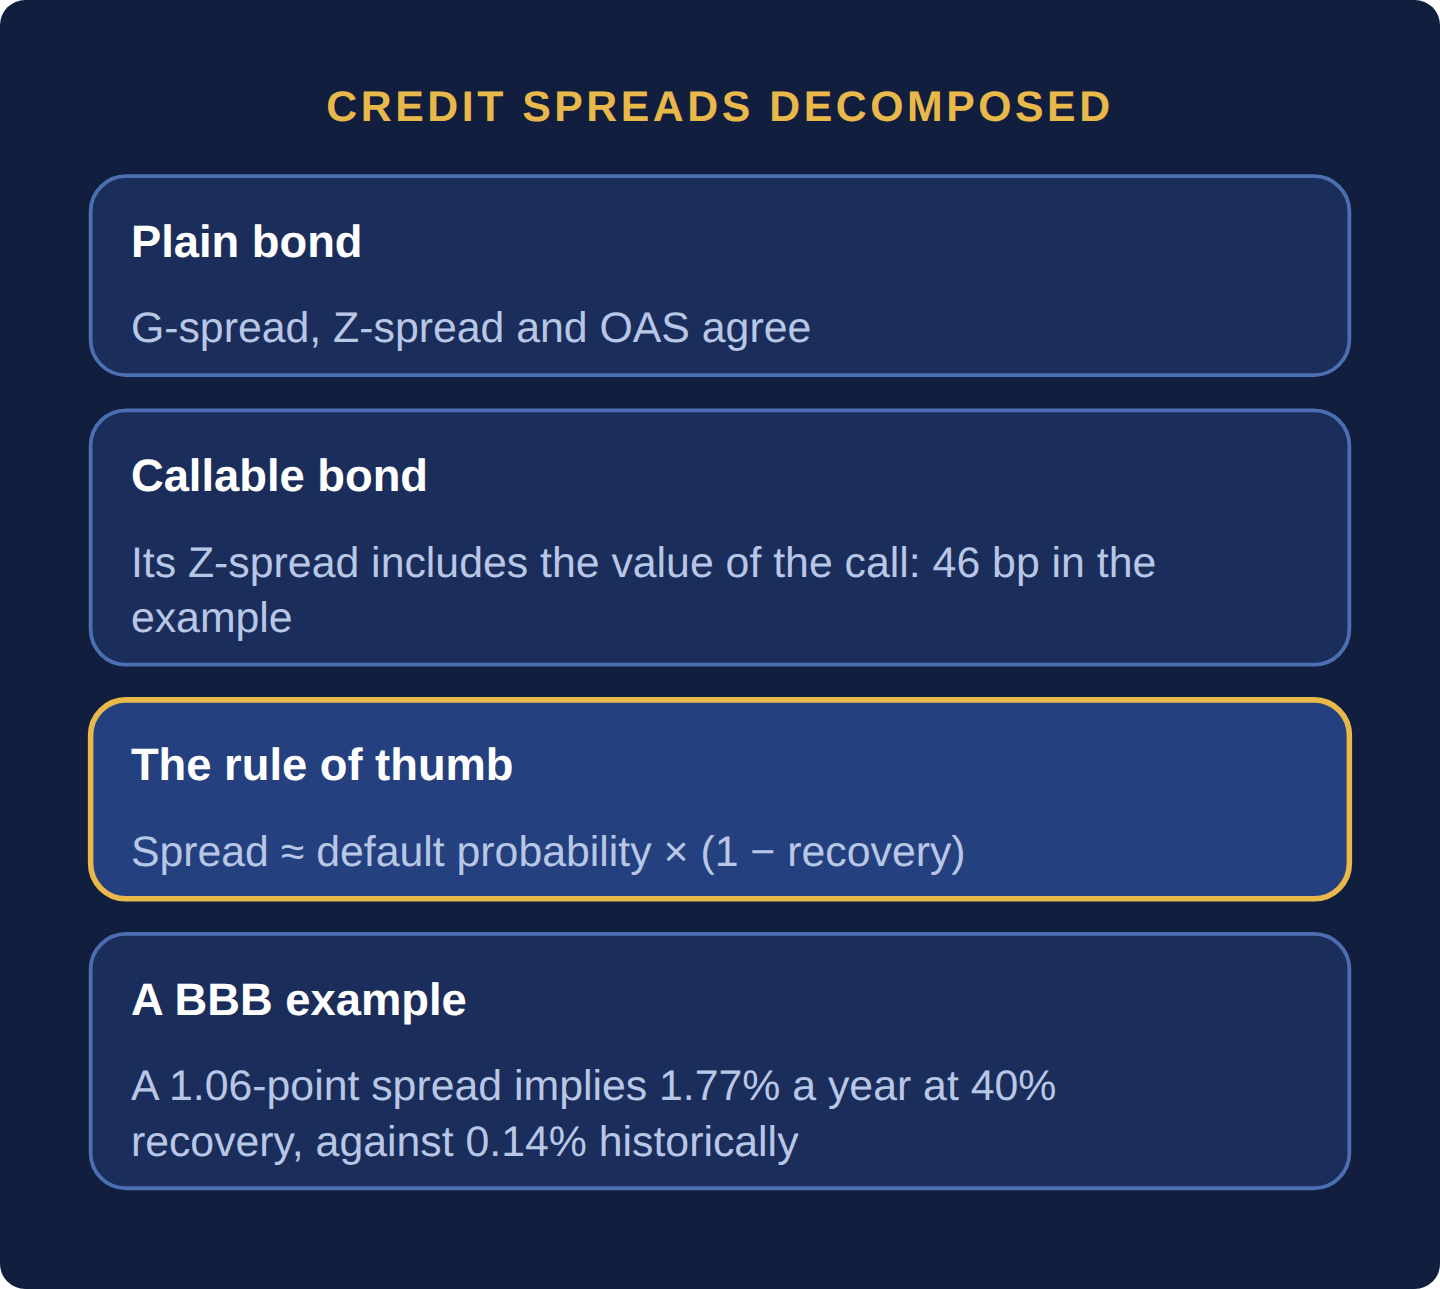
- G-spread, Z-spread and OAS agree for a plain bond; a callable’s Z-spread includes the value of the call (46 bp in this section’s example).
- Spread ≈ default probability × (1 − recovery): a 1.06-point BBB spread implies 1.77% a year at 40% recovery versus 0.14% historical.
- Expected loss is roughly 8% to 16% of the BBB spread; the rest is liquidity and risk premium.
- Spread duration converts widening into dollars: 4.27 × 50 bp ≈ $213,000 on $10 million.
- Compare callables, MBS and ABS on OAS, never on yield.
A corporate bond always yields more than a government bond of the same maturity — the difference is called the credit spread, compensating investors for the additional risk that a corporate borrower, unlike a sovereign government (in its own currency), might actually default. Volume I, Part 3 introduced credit ratings and the BBB− investment-grade cliff; the credit spread is the market’s continuous, real-time pricing of exactly that default risk, moving well before any rating agency formally changes its opinion.
| Spread Component | What It Compensates For |
|---|---|
| Expected Loss | The probability of default multiplied by the expected loss if default occurs |
| Liquidity Premium | Corporate bonds trade less frequently than government bonds, so investors demand extra yield to compensate for the difficulty of selling quickly |
| Risk Premium | Compensation for bearing uncertainty itself, above and beyond the statistically expected loss |
Take a 3-year corporate bond paying a 7% annual coupon, priced at 102.15, and the bootstrapped Treasury curve of Section 3.4: The Yield Curve, Mathematically — Spot Rates and Forward Rates (spot rates 4.500%, 4.807%, 5.015%).
| Measure | Definition and substitution | Result |
|---|---|---|
| G-spread | Bond YTM minus the Treasury par yield of the same maturity: 6.19% − 5.00% | 119 bp |
| Z-spread | One spread z added to every spot rate that reprices the bond: 102.15 = 7 ÷ (1.04500 + z) + 7 ÷ (1.04807 + z)² + 107 ÷ (1.05015 + z)³ | 120 bp |
| Option-adjusted spread (OAS) | Spread over a rate tree calibrated to the curve, after valuing any embedded option; this bond has none | 120 bp |
| Same bond, callable at 100 after years 1 and 2 | Tree with annual steps and 15% rate volatility (illustrative), same 120 bp OAS: price 100.91 | Z-spread 166 bp; OAS 120 bp; option cost 46 bp |
The callable yields 6.66% to maturity against 6.19% for the straight bond, but the extra 46 bp is not pay for credit risk: it is the price of the call option the investor has sold to the issuer. Its effective duration is 1.58 years against 2.65, because a rally makes a call likely and shortens the bond’s expected life. Compare bonds with options on OAS; Z-spread is fine for bullets. Mortgage-backed and asset-backed securities are quoted the same way, with the OAS stripping out the borrower’s prepayment option.
If a bond pays spread s and loses (1 − R) of face on default, where R is the recovery rate, the break-even annual default probability is PD ≈ s ÷ (1 − R). On October 1, 2026, the ICE BofA BBB US Corporate Index option-adjusted spread was 1.06 points; at a 40% recovery assumption, PD ≈ 1.06% ÷ 0.60 = 1.77% a year. History says far less: S&P Global’s 1981–2023 study shows an average one-year default rate of 0.14% for BBB issuers and a five-year cumulative rate of 1.38%. Expected loss = 1.38% × 0.60 ÷ 5 ≈ 0.17% a year (16.6 bp), about 16% of the 106 bp spread; on the one-year rate it is 0.14% × 0.60 = 8.4 bp, about 8%. The rest is the liquidity and risk premiums in the table above. Spreads several times expected losses on investment-grade bonds are the “credit spread puzzle”: Huang and Huang (2012) found that credit risk explains only a small fraction of investment-grade spreads and a much larger fraction of high-yield spreads.
Spread duration turns spread moves into dollars. A $10 million 5-year bond with a 6% coupon priced at par has spread duration 4.27, so a 50 bp widening costs about 4.27 × 0.50% × $10 million ≈ $213,000; the exact reprice is $210,560. A floating-rate note has almost no rate duration but the same spread duration, which is why floaters still lose money when credit sells off.
Credit spreads widen sharply and immediately during periods of economic stress — well before formal downgrades — making them one of the fastest-moving, most closely watched real-time indicators of market-perceived risk across the entire corporate sector, not just for any single company.
Compare credit on OAS against peers with the same rating, sector and spread duration. Buy only when the spread exceeds expected loss (default rate × (1 − R) from a rating-agency table) plus a liquidity charge you can defend, and when the loss from a stress widening (spread duration × widening, for example +150 bp on BBB) fits your risk budget. Ignore yield-to-maturity rankings for callables, MBS and ABS.
Buying a callable bond for its yield. The callable above yields 46 bp more than its straight twin with the same OAS: the pickup is option premium. If rates fall 100 bp, the same tree gives the straight bond +2.70% and the callable +1.28%; on $10 million face, $275,300 versus $128,780, so $146,520 of upside is given away for about $46,000 a year of extra yield. Avoid it: compare OAS and effective duration, not yield.
What is a normal credit spread for a BBB bond?
There is no fixed level; it moves with the cycle. On October 1, 2026, the ICE BofA BBB index spread was 1.06 points and the high-yield index 3.24 points. Judge a spread against its history, its peers and expected loss.
What is the difference between Z-spread and OAS?
The Z-spread is the constant spread over the spot curve that reprices a bond’s promised cash flows. OAS does the same across the paths of an interest-rate model after valuing embedded options. With no options they match; for this section’s callable, Z-spread is 166 bp and OAS 120 bp.
Why do credit spreads widen before a downgrade?
Prices update with every trade, while ratings change after committee review. Investors sell on earnings or leverage news the day it arrives, so a spread far wider than its rating peers often means the market already expects the downgrade.
Credit spreads pay for expected default loss, illiquidity and a risk premium, and historical default losses explain only a small share of investment-grade spreads. Use the Z-spread for plain bonds and OAS for bonds with options, because a callable’s extra yield is mostly option premium, and use spread duration to turn widening into dollars.
Six questions on this chapter. Decide on your answer first, then click “Reveal Answer.”
1. A bond trades at a credit spread of 2.40 points. Assuming 40% recovery, what annual default probability does the spread imply?
- 4.0%
- 2.4%
- 1.44%
- 6.0%
Reveal Answer
Answer: A. PD ≈ spread ÷ (1 − recovery) = 2.40% ÷ 0.60 = 4.0%. The spread must cover the loss given default, not the whole face value.
2. A callable bond has a Z-spread of 166 bp and an option-adjusted spread of 120 bp. What does the 46 bp difference represent?
- The dealer’s bid-ask spread on the trade
- Extra compensation for the issuer’s default risk
- Accrued interest since the last coupon date
- The value of the call option sold to the issuer
Reveal Answer
Answer: D. OAS removes the embedded option; the gap between Z-spread and OAS is option cost, not credit pay.
3. You hold $20 million of bonds with spread duration 5. If credit spreads widen by 40 bp, what is the approximate loss?
- $40,000
- $400,000
- $200,000
- $4,000,000
Reveal Answer
Answer: B. Loss ≈ spread duration × widening × value = 5 × 0.0040 × $20,000,000 = $400,000.
4. What is the credit spread puzzle?
- Spreads always equal default probability times recovery rate
- Spreads change only after a rating agency changes its rating
- Investment-grade spreads far exceed historical default losses
- Junk bond spreads sit below investment-grade spreads on average
Reveal Answer
Answer: C. Expected loss explains only a small fraction of investment-grade spreads (about 8% to 16% of the BBB spread in this section); liquidity and risk premiums make up the rest.
5. Worked problem: A bond’s credit spread is 2.4% and recovery is assumed at 40%. What annual default probability does the spread imply?
Reveal Answer
Answer: Spread ≈ default probability × (1 − recovery), so PD = 2.4% ÷ 0.60 = 4.0% a year.
6. Worked problem: If historical data suggest a default probability of 1.0% and recovery of 40%, what spread would be explained by default alone, and how much of a 2.4% spread is left over?
Reveal Answer
Answer: Default alone explains 1.0% × 0.60 = 0.60%. The remaining 1.80% is compensation for illiquidity and risk premium.
- FRED: 10-Year Treasury Constant Maturity Minus 3-Month (T10Y3M) and Minus 2-Year (T10Y2Y) — Inversion dates, depth and run lengths, 1976–2026; spread levels on Oct 2, 2026 (Part 3.5)
- Federal Reserve Bank of New York: The Yield Curve as a Leading Indicator — Recession-probability model and data file; about 71% for May 2024 (Part 3.5)
- Estrella and Mishkin, The Yield Curve as a Predictor of U.S. Recessions (NY Fed Current Issues, 1996) — 10-year minus 3-month spread predicts recessions two to six quarters ahead (Part 3.5)
- BIS Quarterly Review, Yield curve inversion and recession risk (September 2019) — Term premium caveat on inversion signals (Part 3.5)
- Engstrom and Sharpe, (Don’t Fear) The Yield Curve, Reprise (FEDS Notes, March 2022) — Near-term forward spread argument (Part 3.5)
- Bauer and Mertens, Information in the Yield Curve about Future Recessions (SF Fed Economic Letter, 2018) — Comparison of spreads; ‘no clear evidence that this time is different’ (Part 3.5)
- FRED: ICE BofA BBB US Corporate Index Option-Adjusted Spread (BAMLC0A4CBBB) — BBB spread 1.06 points on Oct 1, 2026 (Part 3.6)
- BAMLH0A0HYM2