
7.8 The Long View — AI's Economic Impact Over the Next Decade
AI numbers come in four kinds: observed data, estimates, scenarios and vendor forecasts, and only the first is a measurement. Forecasts of AI’s payoff differ several-fold.
Why it matters: Knowing which kind of number you are looking at is the first step in judging an AI claim.
Summary: AI numbers come in four kinds: observed data, estimates, scenarios and vendor forecasts, and only the first is a measurement. Forecasts of AI’s payoff differ several-fold.
- Goldman Sachs Research estimated in April 2023 that generative AI could raise global GDP by 7% (almost $7 trillion) and lift productivity growth by 1.5 percentage points over ten years.
- McKinsey put the potential value of generative AI at $2.6 to $4.4 trillion a year across 63 use cases it analyzed (June 2023).
- Daron Acemoglu (2024) finds a rise in total factor productivity of no more than 0.66% over ten years in total, and less than 0.53% once harder-to-learn tasks are allowed for.
- Task-level gains such as the 14% in the support-agent study are real and measured, but they come from single firms and easy-to-measure jobs.
Forecasts of AI’s payoff differ several-fold, so the first skill is to know what kind of number you are reading. Goldman Sachs Research estimated in April 2023 that generative AI could raise global GDP by 7% (almost $7 trillion) and lift productivity growth by 1.5 percentage points over ten years. McKinsey put the potential value of generative AI at $2.6 to $4.4 trillion a year across 63 use cases it analyzed (June 2023). Both are scenarios: they assume how fast AI is adopted and then compute what follows. They are not measurements, and they do not agree with every economist (see the box below).
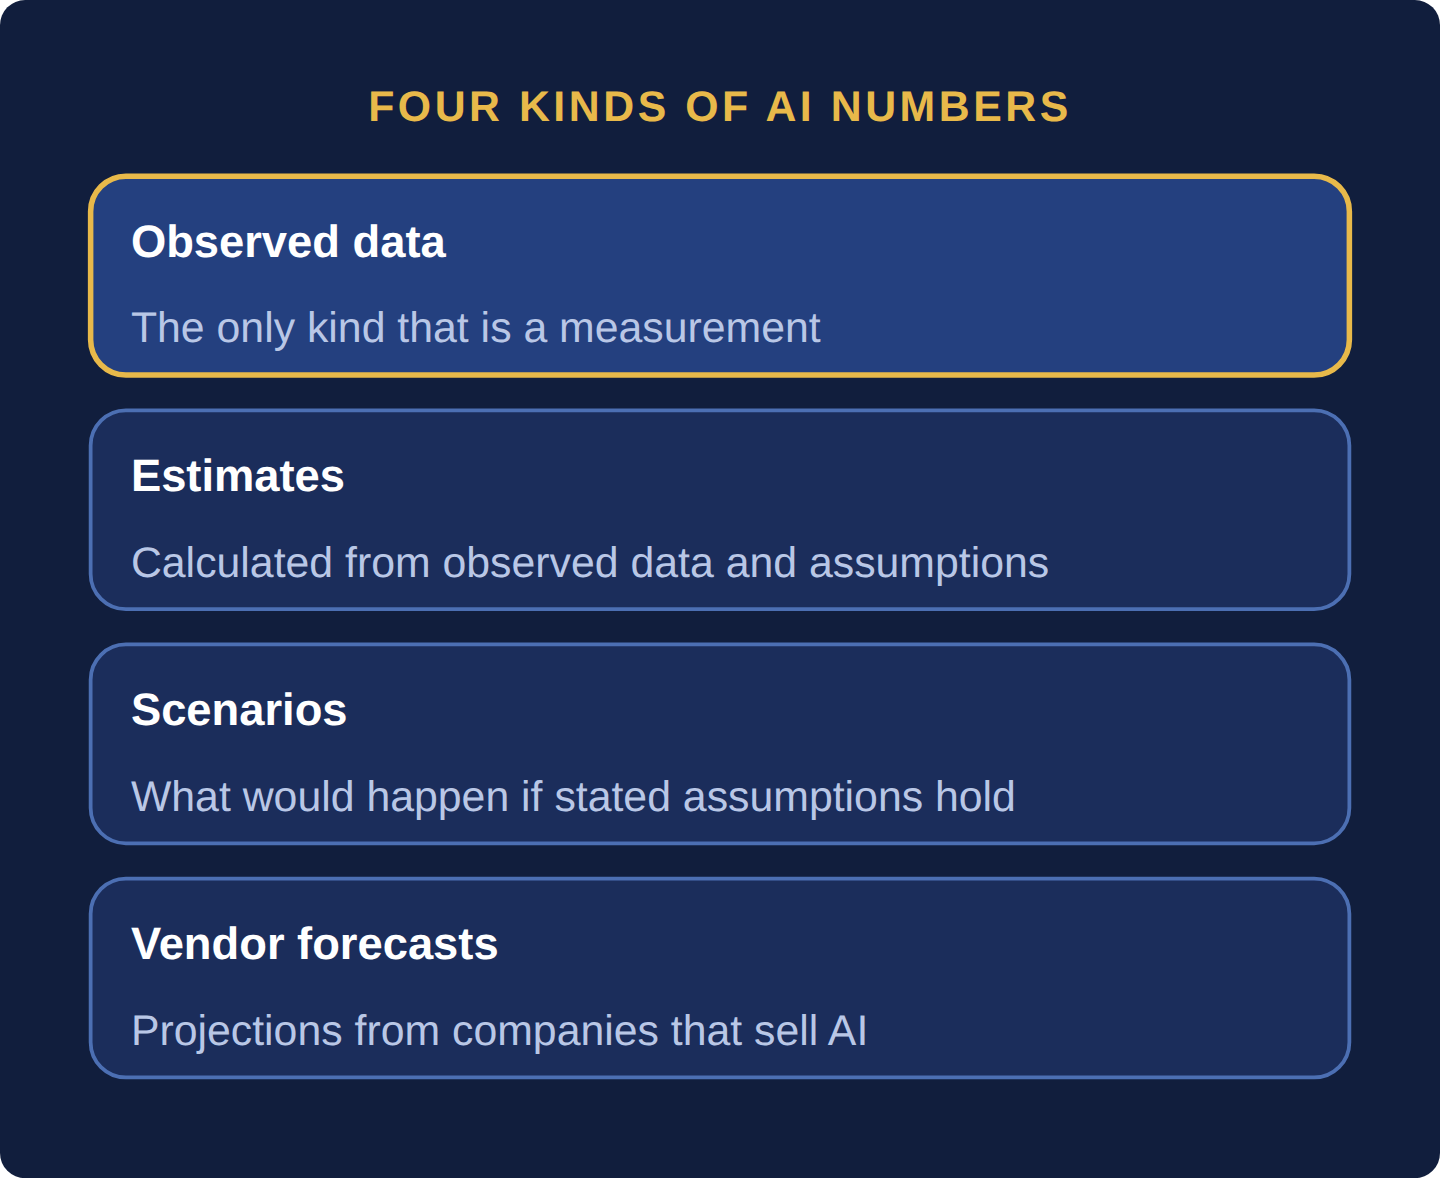
| Kind of number | What it is | Example from Part 7: Artificial Intelligence | How to use it |
|---|---|---|---|
| Observed data | Money spent or earned, counted after the fact in audited filings or official statistics | Four hyperscalers’ capex of $376.1B in 2025; NVIDIA’s data center revenue of $193.7B in the year to January 2026; a 14% productivity gain measured among 5,179 support agents (Section 7.6: AI and Labor Markets — Jobs, Displacement, and New Roles) | The firmest ground, but backward-looking and often narrow |
| Estimate | A number researchers infer when nobody reports it directly | GPT-4’s training compute of about $78M (AI Index); DeepSeek V3’s $5.576M at an assumed $2 per GPU-hour; data centers’ 415 TWh, about 1.5% of world electricity, in 2024 (IEA) | Check the method and what is left out |
| Scenario | “If X happens, then Y”: a model run on stated assumptions | Goldman’s 7% of GDP; McKinsey’s $2.6–4.4T; the IEA Base Case of about 945 TWh of data center demand by 2030 | Read the assumptions first; compare against other scenarios |
| Vendor forecast | A projection by a firm that sells the product or raises money on it | NVIDIA’s outlook of $108.0B (±2%) revenue for its quarter to October 2026; Stargate’s stated intention to invest $500B over four years | Useful for direction, usually tilted upward; check later against observed data |
The high-gain view. Generative AI touches a large share of tasks in office work, so if firms adopt it widely, the gains add up: Goldman’s scenario lifts productivity growth by 1.5 percentage points over a ten-year period. The low-gain view. Daron Acemoglu (NBER Working Paper 32487, 2024) multiplies the share of tasks AI affects by the average cost saving on those tasks and finds a rise in total factor productivity (output growth not explained by more capital or labor) of no more than 0.66% over ten years in total, and less than 0.53% once harder-to-learn tasks are allowed for. What the evidence says. Task-level gains are real and measured (14% in the support-agent study of Section 7.6: AI and Labor Markets — Jobs, Displacement, and New Roles), but they come from single firms and easy-to-measure jobs. What remains open. How fast firms reorganize around the technology, and whether AI creates new tasks rather than only cheapening old ones. A few years of official statistics are unlikely to settle the question.
The key mechanism is productivity. AI augments human work — allowing one professional to produce more in the same hours. In economies facing severe demographic pressure — aging populations in the US, Europe, Japan, China, and South Korea are shrinking the working-age share of the population — AI-driven productivity growth is potentially the primary mechanism sustaining economic output as workforces contract. This makes AI not just a commercial opportunity but a genuine policy imperative for governments facing demographic decline.
But the distribution of AI’s economic benefits will be deeply unequal, at least initially. The companies building and controlling AI infrastructure and foundational models — primarily a small number of US technology companies — will capture an enormous share of early value creation. Countries with the talent, capital, and policy environment to deploy AI quickly will grow faster. Countries dependent on tasks that AI automates without clear alternative employment pathways will face significant labor market disruption.
For anyone building a career in finance, the AI story has a specific and personal relevance. The operations functions at the heart of capital markets — reconciliation, settlement, custody, compliance reporting — are precisely the functions AI is first transforming. This is not a threat; it is an invitation. The professionals who understand both the financial function being transformed AND the AI tools being deployed to transform it will be among the most valuable people in the industry over the next decade. The combination of deep domain expertise and genuine AI literacy is the new premium skill set in financial services. It requires active, deliberate development — it will not come automatically from proximity to AI tools.
How much could AI add to global GDP?
Goldman Sachs Research estimated in April 2023 that generative AI could raise global GDP by 7% (almost $7 trillion) and lift productivity growth by 1.5 percentage points over ten years.
What did McKinsey estimate?
McKinsey put the potential value of generative AI at $2.6 to $4.4 trillion a year across 63 use cases it analyzed (June 2023).
Why do AI forecasts differ so much?
AI numbers come in four kinds, observed data, estimates, scenarios and vendor forecasts, and only observed data is a measurement. Forecasts of AI’s payoff differ several-fold.
AI numbers come in four kinds: observed data, estimates, scenarios and vendor forecasts, and only the first is a measurement. Scenarios differ several-fold: Goldman’s 7% rise in global GDP over ten years against Acemoglu’s gain of at most 0.66% in total factor productivity (about 1% in GDP). Edge cases such as vendor financing, power limits and useful-life choices show where the standard growth story bends.
Four questions and two worked problems on this chapter. Decide on your answer first, then click “Reveal Answer.”
1. What kind of number is Goldman Sachs’s 7% of global GDP?
- A scenario built on assumptions about adoption
- A vendor forecast from a chip seller or cloud firm
- Observed data from audited filings of listed firms
- A legally binding government target for AI output
Reveal Answer
Answer: A. It computes what follows if AI spreads at an assumed pace; it is not a measurement.
2. Acemoglu estimates a rise in total factor productivity of no more than 0.66% over ten years. Why does he reach a much lower number than Goldman?
- He assumes AI is never adopted outside the technology sector, so no task is affected
- He uses a much shorter period of one year, which mechanically shrinks any productivity gain
- He counts only the revenue from chip sales, ignoring any change in the tasks workers perform
- He multiplies the share of tasks affected by the average saving on those tasks
Reveal Answer
Answer: D. Economy-wide gain ≈ share of tasks affected × average saving, which gives well under 1%.
3. Which is a vendor forecast?
- NVIDIA’s revenue outlook for its next quarter
- GPT-4’s estimated training compute in FLOPs
- The IEA’s 415 TWh figure for 2024 data centers
- Hyperscaler capex from 10-K filings, as reported
Reveal Answer
Answer: A. A seller’s own projection is tilted upward and should be checked against later observed data.
4. The IEA reports data centers used about 415 TWh in 2024, about 1.5% of world electricity. What type of number is this?
- A vendor forecast
- An audited filing
- An estimate
- A scenario
Reveal Answer
Answer: C. Nobody reports it directly, so the IEA infers it; its 2030 figure of about 945 TWh is a Base Case scenario.
5. Worked problem: A forecast adds 1.5 percentage points to productivity growth for 10 years. What is the cumulative extra output?
Reveal Answer
Answer: 1.01510 − 1 = 16.1% higher output after ten years.
6. Worked problem: A forecast says AI could raise global GDP by 7%. On a $100tn world economy, how large is that, and what kind of number is it?
Reveal Answer
Answer: 7% × $100tn = $7 trillion. It is a forecast, not a measurement.
7.9 The Geography of Innovation — Silicon Valley, Bengaluru, and the World's Technology Capitals
Invention clusters in about a dozen technology cities because talent, capital and ideas compound when they share the same neighborhoods, an effect economists call agglomeration. Tech cities make the future; the financial cities price and fund it.
Why it matters: It shows why a handful of places produce most of the world’s new technology.
Summary: Invention clusters in about a dozen technology cities because talent, capital and ideas compound when they share the same neighborhoods, an effect economists call agglomeration. Tech cities make the future; the financial cities price and fund it.
- Silicon Valley’s recipe combined Stanford pushing students toward industry, Cold War defense spending seeding the first electronics firms, the 1957 founding of Fairchild Semiconductor and the invention of modern venture capital on Sand Hill Road.
- Fairchild’s alumni went on to found Intel and dozens more firms, giving the valley its silicon and its name.
- Nvidia, OpenAI, Google, Meta and Apple all sit within an hour’s drive of each other, a concentration of market value with no historical precedent.
- Shenzhen, home to China’s first special economic zone (1980), grew from fishing villages into hardware’s capital, home to Huawei, Tencent, BYD and DJI.
Just as money clusters in financial cities, invention clusters in technology cities — because talent, capital, and ideas compound when they share the same coffee shops. One California valley produced more market value than most G20 economies; one Indian city became the back office, engineering lab, and startup capital of the digital world. Tech cities make the future; the financial cities of chapter 9.6 price and fund it.
Software travels at light speed, so innovation should theoretically happen anywhere. In practice it happens in about a dozen postcodes, because of what economists call the agglomeration effect: engineers switch jobs across the street carrying ideas with them, investors can meet five startups before lunch, universities feed talent in, one generation’s successful founders become the next generation’s angel investors (chapter 4.7: Venture Capital and Private Equity — The Pre-IPO World), and failure carries no stigma because the ecosystem instantly reabsorbs you. Each ingredient strengthens the others — which is why clusters, once formed, are extraordinarily hard to dislodge, and why governments worldwide keep trying (and mostly failing) to build “the next Silicon Valley” by decree.
Silicon Valley is the archetype, born of an unusual recipe: Stanford University pushing professors and students toward industry, Cold War defense spending seeding the first electronics firms, the 1957 founding of Fairchild Semiconductor — whose alumni (“Fairchildren”) went on to found Intel and dozens more, giving the valley its silicon and its name — and the invention of modern venture capital on Sand Hill Road. Seventy years later it still commands the world’s deepest pool of risk capital and has been supercharged by the AI era: Nvidia, OpenAI, Google, Meta, and Apple — the very companies whose capex dominates chapter 7.3: The Financial Flows — Where the Trillions Are Going — all sit within an hour’s drive of each other, a concentration of market value with no historical precedent.
Bengaluru is the century’s great counter-example — proof that clusters can be built outside California. Public-sector science (HAL, ISRO, IISc) seeded the talent base; Texas Instruments’ 1985 arrival proved satellite links could put Indian engineers on global projects; Infosys and Wipro industrialized software services through the 1990s; Y2K and the telecom boom scaled it; and each wave compounded into the next — the GCC era (chapter 10.6: From BPO to GCC — India’s Global Delivery Economy), then India’s startup explosion, with Bengaluru hosting the largest share of the country’s hundred-plus unicorns, and now a fast-growing role in global AI engineering, from hyperscaler research teams to GCC-based model and data work. The city is, in effect, where several chapters of this guide physically live. Hyderabad (Microsoft’s and Google’s largest campuses outside the US, plus pharma), Pune, Chennai, and the NCR complete India’s supporting cast.
The rest of the map, briefly: Shenzhen — hardware’s capital, where China’s first special economic zone (1980) grew from fishing villages into the place a prototype becomes a mass-manufactured product in weeks, home to Huawei, Tencent, BYD, and DJI, and the muscle behind chapter 9.1: China — The State-Capitalist Superpower‘s manufacturing dominance. Hsinchu, Taiwan — home of TSMC’s headquarters, R&D and some of its most advanced fabs, on an island whose concentration of leading-edge production is the geographic single point of failure that makes chapter 7.4 a chapter about geopolitics rather than merely chips. Tel Aviv — where military signals-intelligence units function as the world’s most effective startup incubator, especially in cybersecurity. Seattle (Microsoft, Amazon — the cloud’s home town), London (Europe’s fintech capital and DeepMind’s birthplace), and Boston (biotech) round out the network.
Now stitch the geographies together, because they work as one machine: a Bengaluru startup is typically funded from Silicon Valley and Singapore, structured through Luxembourg or Singapore vehicles (chapter 9.5: The Safe Havens — Why Small, Stable Countries Hold the World’s Money), banked across the centers of chapter 9.6: The Great Financial Cities — A Map of Where Money Lives, and exits via an IPO in Mumbai or New York (chapter 4.4: The IPO Process — How a Company Goes Public) — at which point its early employees become the angel investors of the city’s next wave. Innovation geography and financial geography are two halves of a single circulatory system; a country that hosts one and not the other captures only half the value, which is precisely why India’s simultaneous bets on its tech cities and on GIFT City are, at bottom, the same bet.

The standard reading of AI economics is “more spending, more chips, more growth.” Each row is a place where that reading bends.
| Situation | What changes | Why |
|---|---|---|
| An announced plan (“intends to invest $500 billion”) | It is not money spent | Only filings report cash out the door (Section 7.3: The Financial Flows — Where the Trillions Are Going); plans depend on financing, permits and power. |
| A “cheap” model ($5.576 million to train) | The figure covers one final run at an assumed rental price | Research, failed runs, staff and owned hardware are left out, so it cannot be set against an all-in budget. |
| AI gets cheaper per answer | Total spending on chips can still rise | The AI Index found the cost of GPT-3.5-level answers fell over 280-fold from November 2022 to October 2024, while NVIDIA’s revenue rose 3.5-fold over two fiscal years. When a service gets cheaper, use can grow faster than its price falls (the Jevons paradox). |
| Same servers, different useful life | Reported profit moves; cash does not | Each $100B of servers depreciates $16.67B a year over six years but $20B over five (Section 7.3: The Financial Flows — Where the Trillions Are Going); compare lives before comparing margins. |
| A supplier helps finance its customers | Sales start to depend on credit conditions, not only on end demand | This is vendor financing. In August 2026 NVIDIA announced platforms with Apollo, BlackRock, Blackstone, Brookfield, Goldman Sachs and KKR to mobilize over $500B of third-party capital for AI infrastructure, subject to definitive agreements. If that funding tightens, orders can fall together. |
| Chips without power | A finished data center can sit idle | The IEA expects data centers to account for nearly half of US electricity demand growth to 2030; a grid connection, not a GPU, can be the binding constraint. |
| A 14% gain in one job | It does not mean 14% more GDP | Economy-wide gain ≈ share of tasks affected × average saving on them, which gives well under 1% of total factor productivity over ten years in Acemoglu’s estimate. |
| A US lender using AI credit scoring for EU customers | The EU AI Act still applies | The Act follows where the system is used, not where the firm is based (Section 7.7: AI Regulation — How Governments Are Responding). |
1. Trace one rupee of a hyperscaler’s AI capex through the three layers of the AI economy — which companies capture it at each layer, and where does the margin concentrate? 2. A single Taiwanese company fabricates most of the world’s leading-edge chips. Connect this fact to three other chapters in this guide (hint: supply chains, geopolitics, sector concentration). 3. If AI automates 40% of junior reconciliation tasks, what happens to the career ladder that produces senior reconciliation experts — and what should firms do about it? 4. Why has every government-decreed “next Silicon Valley” mostly failed, while Bengaluru — never centrally planned as one — succeeded? List the self-reinforcing ingredients a cluster needs, and which one is hardest to legislate.
What is agglomeration?
The effect by which talent, capital and ideas compound when they share the same neighborhoods, so invention clusters in about a dozen technology cities.
How did Silicon Valley begin?
The recipe combined Stanford pushing students toward industry, Cold War defense spending seeding the first electronics firms, the 1957 founding of Fairchild Semiconductor and the invention of modern venture capital.
How did Fairchild shape the valley?
Fairchild’s alumni went on to found Intel and dozens more firms, giving the valley its silicon and its name.
India’s answer to the capital wall of Section 7.3: The Financial Flows — Where the Trillions Are Going is to rent rather than build. The Union Cabinet approved the IndiaAI Mission in March 2024 with an outlay of ₹10,371.92 crore, aiming at a shared pool of 10,000 or more GPUs built through public-private partnership: private data center firms own the hardware, and the government subsidizes access. By October 2025 the pool had about 38,000 GPUs, offered at a subsidized ₹65 per GPU-hour. Worked number: a startup renting 1,000 GPUs for 30 days pays 1,000 × 24 × 30 × ₹65 = ₹4,68,00,000, or ₹4.68 crore, as a monthly bill, while buying the hardware would mean a large upfront outlay and the depreciation risk shown in Section 7.3: The Financial Flows — Where the Trillions Are Going. The trade-off is control: capacity is allocated by a government program, and the subsidy is a budget line that must be renewed. On rules, India has no AI-specific statute; MeitY’s India AI Governance Guidelines (November 5, 2025) are principles-based, built around “do no harm” and innovation sandboxes. India’s largest exposure is different from America’s: its IT services firms and global capability centers (Section 10.6: From BPO to GCC — India’s Global Delivery Economy) do many of the tasks Section 7.6: AI and Labor Markets — Jobs, Displacement, and New Roles lists as most exposed.
Invention clusters in about a dozen technology cities because talent, capital and ideas compound when they share neighborhoods, an effect called agglomeration. Silicon Valley grew from Stanford, Cold War defense spending, Fairchild Semiconductor and modern venture capital.
Four questions and two worked problems on this chapter. Decide on your answer first, then click “Reveal Answer.”
1. What does the agglomeration effect explain?
- Why stock exchanges merge, since bigger venues attract more listings
- Why innovation clusters in a few places even though software travels anywhere
- Why chip prices fall every year, since scale lowers each generation’s cost
- Why governments tax technology firms, since concentrated profits are easy to reach
Reveal Answer
Answer: B. Talent, capital and ideas compound when they sit close together.
2. Which firm’s 1957 founding gave Silicon Valley its name and many of its later founders?
- Hewlett-Packard Company
- Texas Instruments Inc.
- Apple Computer Company
- Fairchild Semiconductor
Reveal Answer
Answer: D. Fairchild’s alumni, the Fairchildren, founded Intel and dozens more.
3. What event in 1985 does the chapter credit with showing Indian engineers could work on global projects from Bengaluru?
- ISRO launched its first rocket into orbit
- Infosys listed on NASDAQ for the first time
- Wipro opened an office in New York City
- Texas Instruments arrived with satellite links
Reveal Answer
Answer: D. TI’s arrival proved satellite links could connect Indian engineers to global work.
4. Why is Taiwan, home of Hsinchu, called a single point of failure?
- It hosts the only stock exchange in Asia
- It is the sole source of ASML machines
- Most of TSMC’s top fabs sit on one island
- It is where all venture capital is based
Reveal Answer
Answer: C. Concentration of leading-edge fabrication in Taiwan ties chapter 7.4: The Semiconductor Geopolitical Crisis‘s geopolitics to chips.
5. Worked problem: A city has 40% of $200bn of venture funding. How much is that, and what is the rest of the world’s share in dollars?
Reveal Answer
Answer: 40% × $200bn = $80bn; the rest = $120bn.
6. Worked problem: If a cluster’s firms are 25% more productive because of agglomeration, what output does a firm worth 100 produce in the cluster?
Reveal Answer
Answer: 100 × 1.25 = 125.
- Stanford HAI, AI Index Report — Annual data-driven report on AI progress, adoption and economic impact
- PIB, Cabinet approves IndiaAI Mission (Mar 7, 2024)
- PIB backgrounder (Oct 12, 2025)
- PIB, India AI Governance Guidelines (Nov 5, 2025)