
Each of the 11 stock market sectors has its own economics. Some, like energy, are cyclical and commodity-driven, while others are protected by moats such as distribution networks. India’s position differs in each.
Why it matters: Sector economics explain why stocks in different sectors react so differently to the same news.
Summary: Each of the 11 sectors has its own economics: some, like energy, are cyclical and commodity-driven, while others are protected by moats such as distribution networks. India’s position differs in each.
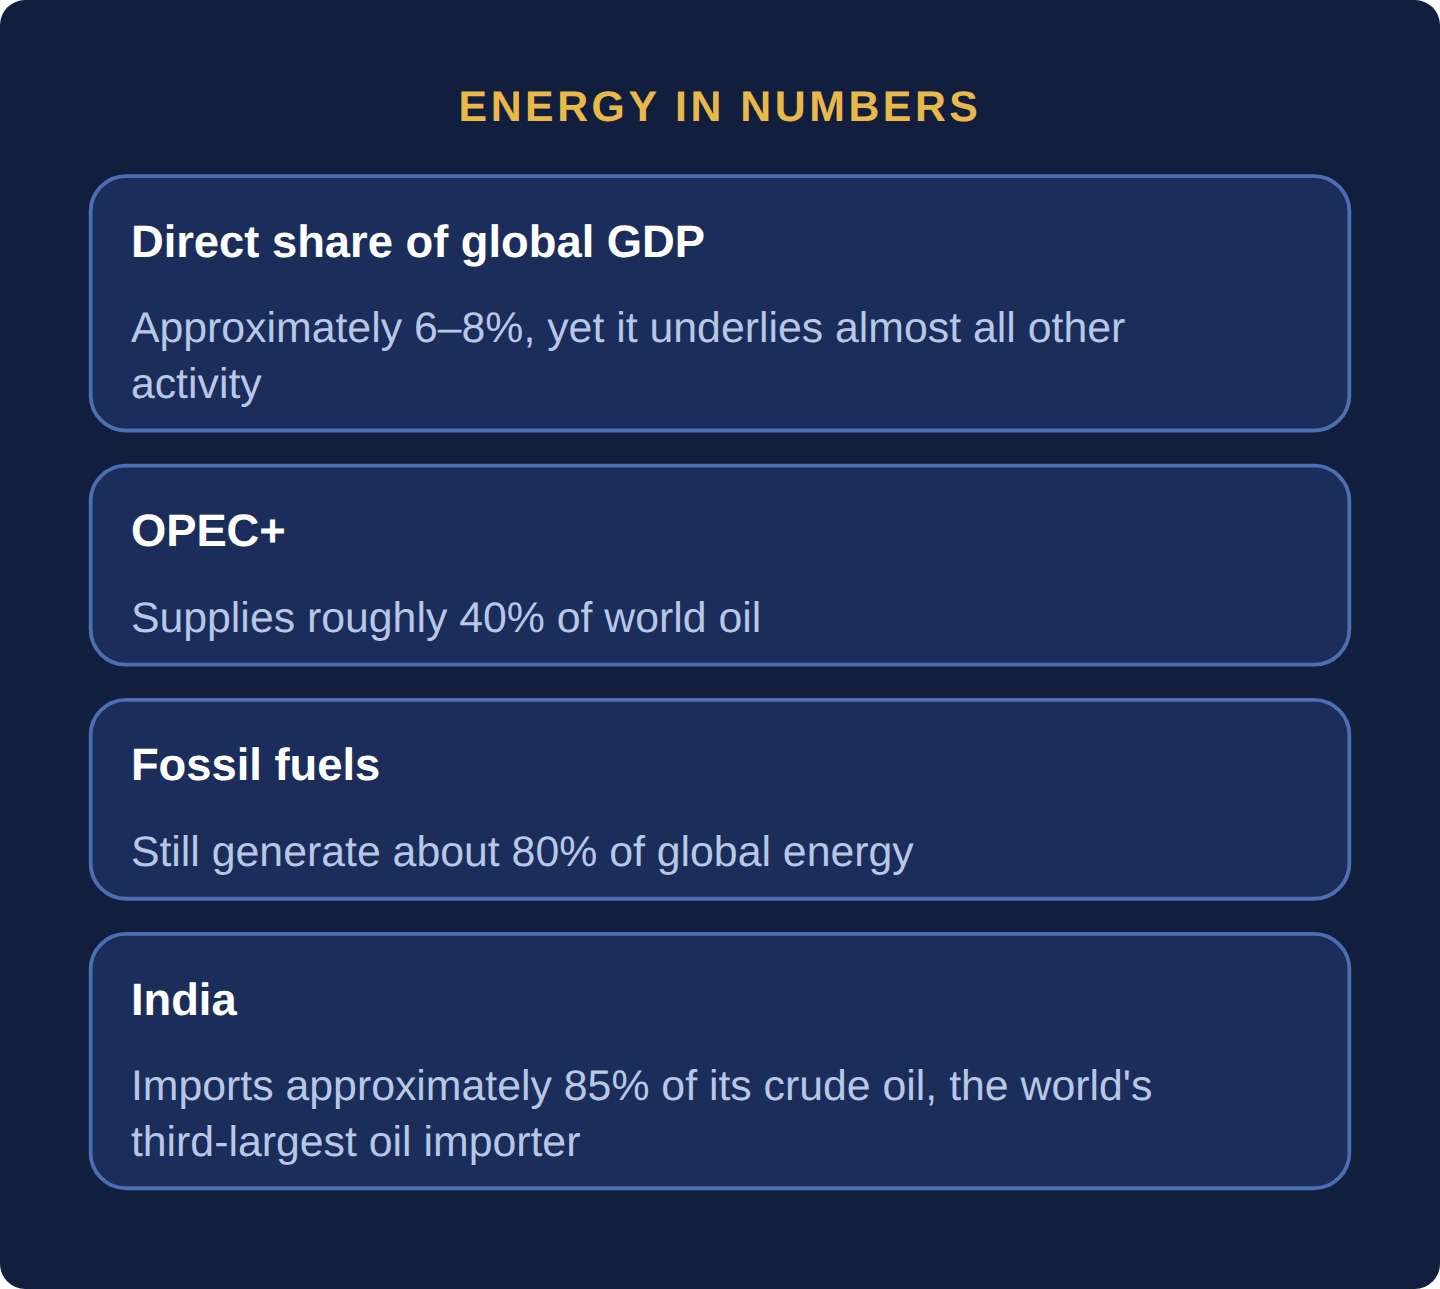
- Energy is approximately 6–8% of global GDP in direct terms yet underlies virtually all other economic activity; OPEC+ supplies roughly 40% of world oil, and fossil fuels still generate about 80% of global energy.
- India imports approximately 85% of its crude oil requirements, making it the world’s third-largest oil importer.
- Global military spending reached about $2.9 trillion in 2025 (SIPRI, April 2026).
- India’s “Make in India” policy targets 25% of GDP from manufacturing, against about 17% today.
- Amazon controls approximately 40% of US e-commerce, while in India reaching 650,000 villages through local distributors and kirana stores is a moat that takes decades to build.
1. Energy
Classification: Cyclical — highly sensitive to commodity prices. The energy sector encompasses the extraction, production, refining, and distribution of energy — primarily oil and natural gas, but increasingly renewable energy. Energy is approximately 6–8% of global GDP in direct terms, but it underlies virtually all other economic activity. Every factory, every transport network, every data center runs on energy. Oil prices are the single most globally watched commodity price, and an energy supply shock — as demonstrated in 2022 following Russia’s Ukraine invasion — immediately transmits into inflation across every other sector.
The sector is dominated by a small number of supermajors: ExxonMobil, Chevron, Shell, BP, TotalEnergies, and Saudi Aramco — the world’s most profitable company in most years by net income. OPEC+ (the group of OPEC members and allied producers, including Saudi Arabia and Russia, that supplies roughly 40% of world oil) actively manages output to influence prices. NYMEX WTI crude and ICE Brent crude are the two global price benchmarks. The defining tension in energy is the transition: fossil fuels still generate ~80% of global energy; governments are committed to net-zero targets; the investment requirements for both maintaining existing production and building renewable capacity simultaneously are enormous.
Key analyst metrics: EV/EBITDA, reserve replacement ratio, production cost per barrel, breakeven oil price, ROCE (Return on Capital Employed).
India’s position: India is a significant net oil importer — approximately 85% of its crude oil requirements are imported, making it the world’s third-largest oil importer. This creates a structural current account vulnerability when oil prices rise. Domestically, ONGC and Oil India are the major upstream producers; Indian Oil Corporation, Bharat Petroleum, and HPCL dominate refining and distribution. Reliance Industries operates one of the world’s largest and most complex single-location refineries at Jamnagar, Gujarat. On renewable energy, Adani Green Energy and Tata Power are building capacity at significant scale.
2. Materials
Classification: Cyclical — closely tied to industrial production and construction cycles. The materials sector covers the extraction and initial processing of raw materials — metals and mining (iron ore, copper, aluminum, gold, silver, lithium), chemicals (industrial, agricultural, specialty), construction materials (cement, glass, aggregates), and forestry and paper. Materials are the inputs into almost everything else the economy produces. When China — the world’s largest consumer of industrial metals — builds a city or slows down, commodities markets feel it globally.
Commodity supercycles — prolonged periods of rising commodity prices driven by structural demand growth, typically from industrializing economies — have historically been one of the most powerful investment themes. The early 2000s supercycle was driven by China’s rapid industrialization. The next potential cycle may be driven by the energy transition: electric vehicles require significantly more copper, lithium, cobalt, and nickel than internal combustion engines, and renewable energy infrastructure is materials-intensive.
Key analyst metrics: EV/EBITDA, production cost vs. spot commodity price, AISC (All-In Sustaining Cost for mining), cash cost per metric ton.
India’s position: India has significant materials production capacity. Tata Steel and JSW Steel are among the world’s largest steel producers; Hindalco is a major global aluminum player (and owns Novelis, the world’s largest aluminum rolling company); UltraTech Cement is the world’s third-largest cement company outside China. Asian Paints, Berger Paints, and Pidilite Industries (Fevicol) are notable branded specialty chemicals/materials businesses serving India’s growing construction and consumer markets.
3. Industrials
Classification: Cyclical — sensitive to capital expenditure cycles, infrastructure spending, and global trade volumes. The industrials sector is the broadest in the economy, covering aerospace and defense, machinery and equipment, construction and engineering, transportation and logistics, electrical equipment, and business services. Industrials are essentially the companies that build and operate the physical infrastructure of the economy — factories, airports, ships, aircraft, power lines, and industrial equipment.
Industrials are often called a “leading indicator” sector — when companies begin ordering new equipment and infrastructure, it signals confidence in future growth. The global defense subsector has grown significantly since 2022, with European NATO members committing to higher defense budgets following Russia’s invasion of Ukraine and geopolitical tensions driving procurement across Asia and the Middle East. Global military spending reached about $2.9 trillion in 2025 (SIPRI, April 2026).
Key analyst metrics: Order book growth, book-to-bill ratio, operating leverage, ROCE, backlog (the unexecuted portion of confirmed orders — a forward indicator of future revenues).
India’s position: Larsen & Toubro (L&T) is the flagship Indian industrial conglomerate — engineering, construction, defense, heavy equipment, and technology — and one of India’s most important companies. Bharat Forge is a world-class automotive and aerospace components manufacturer. Hindustan Aeronautics (HAL) and Bharat Electronics Limited (BEL) are India’s primary defense manufacturers. India’s “Make in India” policy has prioritized defense indigenization and manufacturing sector growth, targeting 25% of GDP from manufacturing versus the current ~17%.
4. Consumer Discretionary
Classification: The most cyclical consumer sector — highly sensitive to income, employment, and consumer confidence. Consumer discretionary covers goods and services people buy when they have money to spare — automobiles, consumer electronics, restaurants, hotels, travel, retail, luxury goods, and e-commerce. When employment is high and incomes growing, discretionary spending booms. When people are worried about their jobs or incomes, it is the first area where they cut back. This makes the sector an excellent real-time indicator of economic health and consumer sentiment.
E-commerce has structurally redefined this sector. Amazon controls approximately 40% of US e-commerce; Alibaba and JD.com dominate China. The shift from physical retail to digital commerce has destroyed the economics of traditional department stores and many shopping mall retailers while creating extraordinary value in fulfillment infrastructure, last-mile logistics, and digital payment systems. Luxury goods (LVMH, Hermès, Richemont) sit within consumer discretionary but behave differently — demand from ultra-high-net-worth consumers is less economically sensitive.
Key analyst metrics: Same-store sales growth, gross margin, inventory turnover, customer acquisition cost (CAC) and lifetime value (LTV) for digital businesses.
India’s position: India’s rapidly expanding middle class is one of the most significant demand stories in global consumer discretionary. Maruti Suzuki (largest car manufacturer by volume), Tata Motors Passenger Vehicles (passenger vehicles and Jaguar Land Rover), Titan (jewelry, watches — one of India’s most admired consumer brands), Eternal (Zomato’s parent) and Swiggy (food delivery), Nykaa (beauty and fashion e-commerce), and the fast-growing quick-commerce sector are all expressions of India’s discretionary consumption story at different price points.
5. Consumer Staples
Classification: Defensive — demand is resilient through the economic cycle. Consumer staples covers the goods people buy regardless of economic conditions — food, beverages, tobacco, household products, and personal care. In a recession, households may trade down from branded to generic versions, but they do not stop buying toothpaste, cooking oil, or soap. This resilience makes consumer staples the classic defensive sector: lower growth in boom times, but stable revenues and reliable dividends during downturns.
The defining competitive advantage in consumer staples is brand — companies like Procter & Gamble, Unilever, and Nestlé have built brands that command price premiums across generations and geographies. Distribution networks and shelf space are equally critical: in markets like India, reaching 650,000 villages through a network of local distributors and kirana stores is a moat that takes decades to build and cannot be easily replicated. The sector is also characterized by consistent, growing dividends — making it a significant holding for income-focused institutional investors.
Key analyst metrics: Organic revenue growth (volume × price), gross margin, market share by category, working capital management.
India’s position: Hindustan Unilever (HUL) — the Indian subsidiary of Unilever — is one of India’s most broadly distributed companies, present in categories from Lifebuoy soap to Knorr soups to Dove shampoo. ITC (cigarettes, FMCG, hotels, agribusiness) is another cornerstone. Nestlé India (Maggi noodles, KitKat, Nescafé), Dabur (Ayurvedic health and personal care), Marico (Parachute coconut oil, Saffola), and Godrej Consumer Products are significant domestic players. Rural India, where approximately 60% of the population lives, is the growth frontier for every staples company — distribution reach into Tier 3 and 4 markets is the primary competitive battleground.
6. Health Care
Classification: Defensive with growth characteristics — demand is non-discretionary; innovation cycles create occasional high-growth periods. Healthcare encompasses pharmaceutical companies (developing and manufacturing medicines), biotechnology (using biological systems to develop treatments), medical devices (from surgical instruments to MRI machines), hospitals and health systems, health insurance, and healthcare IT. Global healthcare spending exceeds $9 trillion annually — approximately 10% of global GDP — and is growing as populations age in developed economies and expand access in emerging markets.
The pharmaceutical industry is defined by a fundamental tension: developing a new drug costs approximately $1–2 billion on average and takes 10–15 years, most candidates fail in clinical trials, and upon regulatory approval the company gets a patent-protected window of typically 20 years from filing date (which means 10–12 years of marketing exclusivity by the time a drug launches) to recoup its investment and earn a return. When patents expire, generic manufacturers enter and prices collapse by 80–90%. This “patent cliff” dynamic makes pipeline management the most critical activity in pharmaceutical companies.
Key analyst metrics: Pipeline value (risk-adjusted NPV of drugs in development), patent expiry schedule, R&D spend as a percentage of revenue, ROIC, gross margin (which can exceed 80% for branded pharmaceuticals).
India’s position: India is globally significant in generic pharmaceuticals — often called the pharmacy of the world. Indian companies supply approximately 20% of global generic medicines by volume and 60% of global vaccines. Sun Pharmaceutical (India’s largest pharma company by market cap), Dr. Reddy’s Laboratories, Cipla, Lupin, and Divi’s Laboratories are the major players. India’s combination of cost-competitive manufacturing, strong chemistry talent, and regulatory approvals from the US FDA and European EMA for its facilities makes it an indispensable part of global pharmaceutical supply chains.
7. Financials
Classification: Cyclical — highly sensitive to interest rates, credit quality, and the economic cycle. The financial sector connects all other sectors — facilitating payments, allocating capital, managing risk, and enabling trade. It encompasses banks (retail, commercial, investment), insurance companies, asset managers, stock exchanges, payment companies, and fintech firms. Financial services typically represents well under 20% of broad US and global stock indices, but far more in bank-heavy markets such as India (37% of the Nifty 50, see the India Lens below), making it one of the largest sector allocations for most institutional portfolios.
Banks earn from the net interest margin (the spread between lending rates and deposit rates) — which widens when interest rates rise, as they did sharply in 2022–2023, boosting bank profitability even as higher rates pressured other sectors. Insurance companies earn from the float — the premium income received and invested before claims are paid. Asset managers earn from fees on assets under management (AUM). Payment companies — Visa, Mastercard, Razorpay, Paytm, PhonePe — earn from transaction fees and are increasingly the infrastructure layer of the digital economy.
Key analyst metrics: NIM (Net Interest Margin), NPL/NPA ratio (Non-Performing Loans/Assets — bad loans as a percentage of total loans; the key credit quality indicator), ROE, CET1 capital ratio (Basel III capital adequacy), cost-to-income ratio.
India’s position: India’s financial sector is large, growing, and bifurcated between state-owned banks (SBI, Bank of Baroda, PNB — which together hold the majority of deposit market share) and private banks (HDFC Bank, ICICI Bank, Kotak Mahindra Bank, Axis Bank) that have historically generated superior return on equity. LIC (Life Insurance Corporation) is India’s largest institutional investor by assets. The NBFC (Non-Banking Financial Company) sector is large and important — Bajaj Finance is arguably India’s most successful consumer lending NBFC. India’s UPI payments infrastructure, built by NPCI, has become a global model for real-time retail payments.
8. Information Technology
Classification: Growth sector with cyclical elements — long-term structural growth, short-term sensitivity to enterprise spending cycles. Technology is the largest sector by market capitalization in US indices and has been the world’s fastest-growing major sector for three decades. It encompasses semiconductors and semiconductor equipment, software (operating systems, enterprise software, SaaS), IT services (outsourcing and consulting), cloud computing, and artificial intelligence infrastructure (covered in depth in Part 7: Artificial Intelligence).
The semiconductor supply chain is one of the most geopolitically sensitive in the world. TSMC (Taiwan Semiconductor Manufacturing Company) manufactures approximately 90% of the world’s most advanced chips — including those for Apple, NVIDIA, AMD, and Qualcomm. Its physical location in Taiwan, combined with escalating US-China tensions, has made semiconductor supply chain security a top-tier national security issue for multiple governments. The US CHIPS Act ($52 billion), EU Chips Act, India Semiconductor Mission, and Japan’s semiconductor support programs all reflect the same geopolitical imperative: diversify advanced chip manufacturing away from any single point of vulnerability.
Key analyst metrics: ARR (Annual Recurring Revenue) for SaaS businesses, Rule of 40 (revenue growth % + EBITDA margin % should exceed 40% for healthy software businesses), NRR (Net Revenue Retention), gross margin, R&D intensity.
India’s position: India’s IT services industry — centered in Bangalore, Hyderabad, Pune, and Chennai — is one of India’s most globally significant economic assets. TCS (Tata Consultancy Services, India’s fourth-largest listed company in AMFI’s ranking for the second half of 2025, averaging about ₹11.3 lakh crore), Infosys, Wipro, HCL Technologies, and Tech Mahindra are global leaders in IT outsourcing, digital transformation consulting, and enterprise software implementation. The sector generates over $200 billion annually in exports, employs over 5 million people directly, and is India’s largest source of foreign exchange earnings. The AI transition is the most important strategic challenge and opportunity this industry faces — as clients automate more work, the demand for traditional IT services may compress even as demand for AI-enabled services grows.
9. Communication Services
Classification: Mixed — defensive telecom operators combined with growth-oriented digital platforms. Communication services is a somewhat heterogeneous sector, combining traditional telecom infrastructure providers (mobile networks, broadband, fiber) with internet platforms (search, social media, streaming, gaming). The telecom component is quasi-utility like — recurring subscription revenues, regulated in most markets, capital-intensive but stable. The digital platform component is high-growth, network-effect driven, and advertising-funded in most cases.
5G rollout is the defining infrastructure investment of the current decade in traditional telecom — enabling connected devices, autonomous vehicles, and smart city applications that the next wave of economic growth depends on. In digital platforms, artificial intelligence is transforming advertising targeting, content moderation, recommendation systems, and the very nature of how users interact with search and social media. The sector faces increasing regulatory scrutiny globally — from antitrust investigations into Google and Meta in the US and EU to data localization requirements in India and content moderation mandates everywhere.
Key analyst metrics: ARPU (Average Revenue Per User), subscriber churn rate, capex/revenue ratio (critical for assessing how much of cash flow is consumed by network maintenance), EBITDA margin, net adds (subscriber growth).
India’s position: India’s telecom sector was dramatically restructured by the entry of Reliance Jio in September 2016, which offered effectively free voice calls and extremely cheap data — triggering a price war that reduced the industry from over a dozen operators to three significant players: Jio (500+ million subscribers, the largest market share at roughly 40%), Bharti Airtel (strong in premium urban and enterprise segments, Africa operations), and a distressed Vodafone Idea. India now has one of the world’s cheapest mobile data markets and the world’s second-largest smartphone user base. 5G launched in India in October 2022 and has rolled out rapidly since.
10. Utilities
Classification: The most defensive sector — revenues stable across the entire economic cycle; heavily regulated. Utilities provide essential infrastructure services — electric power generation and transmission, natural gas distribution, water treatment and supply, and waste management. In most markets, utilities operate as regulated monopolies or near-monopolies: a single company supplies electricity or water to a geographic area, and a regulator determines the permitted pricing and the allowed return on the capital invested. This regulatory compact produces predictable, stable cash flows — making utilities the classic income investment, held for yield rather than growth.
The energy transition is creating the biggest change in utilities in a century. NextEra Energy in the US has become the world’s largest producer of wind and solar energy, while retaining its regulated utility base in Florida. Most major European utilities are in the midst of multi-decade transitions from fossil fuel generation to renewables. The AI-driven data center construction boom (Part 7: Artificial Intelligence) is creating an unprecedented electricity demand surge in US and European markets — putting strain on grids that were not designed for this load, and creating urgency around nuclear energy re-evaluation as a reliable, low-carbon baseload power source.
Key analyst metrics: Regulated Asset Base (RAB), allowed rate of return (set by regulator), EV/EBITDA, dividend yield, capex program scale (indicating future growth in RAB).
India’s position: India’s power sector is one of the world’s largest by installed capacity. NTPC (National Thermal Power Corporation) is the largest power generator; Power Grid Corporation operates the national transmission network. The renewable energy transition is moving rapidly — India has committed to 500 GW of non-fossil capacity (renewables, large hydro and nuclear) by 2030, announced at COP26 in November 2021; it had 304.3 GW at the end of August 2026, about 55% of all installed capacity. Adani Green Energy and Tata Power are building at significant scale. India’s electricity grid, however, faces challenges in reliability and coverage — roughly 16–18% of electricity is lost in transmission and distribution (T&D losses; 17.7% in FY2022-23), compared to about 5–8% in developed markets. Solving this is both a massive infrastructure challenge and a commercial opportunity.
11. Real Estate
Classification: Interest-rate sensitive — inversely correlated with interest rate cycles. Real estate encompasses residential property, commercial property (office, retail, industrial/logistics), and Real Estate Investment Trusts (REITs) — publicly listed vehicles that own and operate portfolios of income-producing properties, paying out at least 90% of their income as dividends in most markets. Construction typically represents roughly 5–9% of GDP, and real estate activities including housing services add a comparable amount, making real estate one of the most economically significant sectors.
The sector’s interest rate sensitivity is direct and immediate: higher borrowing costs reduce buyer affordability in residential property, increase the cost of financing commercial real estate development, and compress REIT valuations (since their income streams become less valuable relative to risk-free rates when rates rise). The 2022–2023 rate cycle demonstrated this viscerally: US 30-year mortgage rates more than doubled from 3.22% (January 2022) to 7.79% (October 2023, Freddie Mac), freezing housing transaction volumes and stalling new construction. Meanwhile, the growth of e-commerce has driven explosive demand for logistics and warehouse real estate (benefiting companies like Prologis), while remote work fundamentally disrupted office real estate demand in major cities.
Key analyst metrics: NAV (Net Asset Value) per share, FFO (Funds From Operations — the REIT equivalent of earnings, adding back depreciation), cap rate (Net Operating Income ÷ Property Value — the yield on real estate), occupancy rate, like-for-like rental growth.
India’s position: India has a massive and growing residential real estate market driven by urbanization, rising incomes, and a young population forming new households. DLF, Godrej Properties, Prestige Estates, and Macrotech (Lodha) are the major listed developers. India’s REIT market is still young but growing: Embassy REIT (office parks), Mindspace REIT (office), and Nexus Mall REIT (retail) are the established platforms. Data center real estate is the fastest-growing sub-sector, driven by India’s digital economy growth and AI-related compute demand.
What are the 11 stock market sectors?
Energy, materials, industrials, consumer discretionary, consumer staples, health care, financials, information technology, communication services, utilities and real estate.
How important is the energy sector?
Energy is approximately 6–8% of global GDP in direct terms yet underlies virtually all other economic activity. OPEC+ supplies roughly 40% of world oil, and fossil fuels still generate about 80% of global energy.
How dependent is India on imported oil?
India imports approximately 85% of its crude oil requirements, making it the world’s third-largest oil importer.
What protects a company from competitors?
Moats such as distribution networks protect some sectors, while others, like energy, are cyclical and commodity-driven.
Each of the 11 sectors has its own economics: energy is cyclical and commodity-driven, while others are protected by moats such as distribution networks. India imports about 85% of its crude oil, and its position differs sector by sector.
Five questions and two worked problems on this chapter. Decide on your answer first, then click “Reveal Answer.”
1. According to the chapter, what happened to bank profitability as rates rose in 2022–2023?
- Rates had no effect on bank earnings
- Bank profits fell as loan demand vanished
- Bank profits were capped by deposit insurance
- Wider net interest margins lifted profits
Reveal Answer
Answer: D. Banks earn the spread between lending and deposit rates, which widened as rates rose.
2. What is the pharmaceutical “patent cliff”?
- Regulators cap drug prices once sales peak
- Approval odds fall sharply during late-stage clinical trials
- Prices collapse as generics enter after patent expiry
- R&D budgets are cut when patents are filed
Reveal Answer
Answer: C. When a patent expires, generic makers enter and prices typically collapse by 80–90%, so pipeline management is critical.
3. Why do regulated utilities produce stable cash flows?
- Their customers prepay their bills for several years ahead
- A regulator sets prices and an allowed return
- They hedge every input cost with futures
- They are exempt from corporate income tax
Reveal Answer
Answer: B. Utilities usually operate as regulated monopolies, and the regulator determines permitted pricing and the allowed return.
4. An office building earns net operating income of $8 million a year and is valued at $160 million. What is its cap rate?
- 5%
- 2%
- 0.5%
- 20%
Reveal Answer
Answer: A. Cap rate = Net Operating Income ÷ Property Value = $8m ÷ $160m = 0.05 = 5%.
5. What exactly is India’s 2030 capacity target announced at COP26?
- 500 GW of wind and solar capacity by 2035
- 500 GW of renewables by 2047
- 500 GW of non-fossil capacity
- 500 GW of solar capacity alone
Reveal Answer
Answer: C. The target is 500 GW of non-fossil capacity by 2030; India had 304.3 GW at the end of August 2026.
6. Worked problem: An equal-weight portfolio holds one position in each of the 11 sectors. What is each weight?
Reveal Answer
Answer: 1 ÷ 11 = 9.09%.
7. Worked problem: A cap-weighted index has technology at 31%. How much larger is that than the equal weight?
Reveal Answer
Answer: 31% ÷ 9.09% = 3.4 times the equal weight.
- PIB, National Statement by the Prime Minister at COP26 (November 1, 2021) — 500 GW non-fossil capacity by 2030 and net zero by 2070 (Sections 1.17, 6.2, 6.3)
- MNRE, Physical Progress — Non-fossil capacity 304.33 GW on Aug 31, 2026