
6.7 The Forensic Accounting Toolkit — Ratios and Red Flags
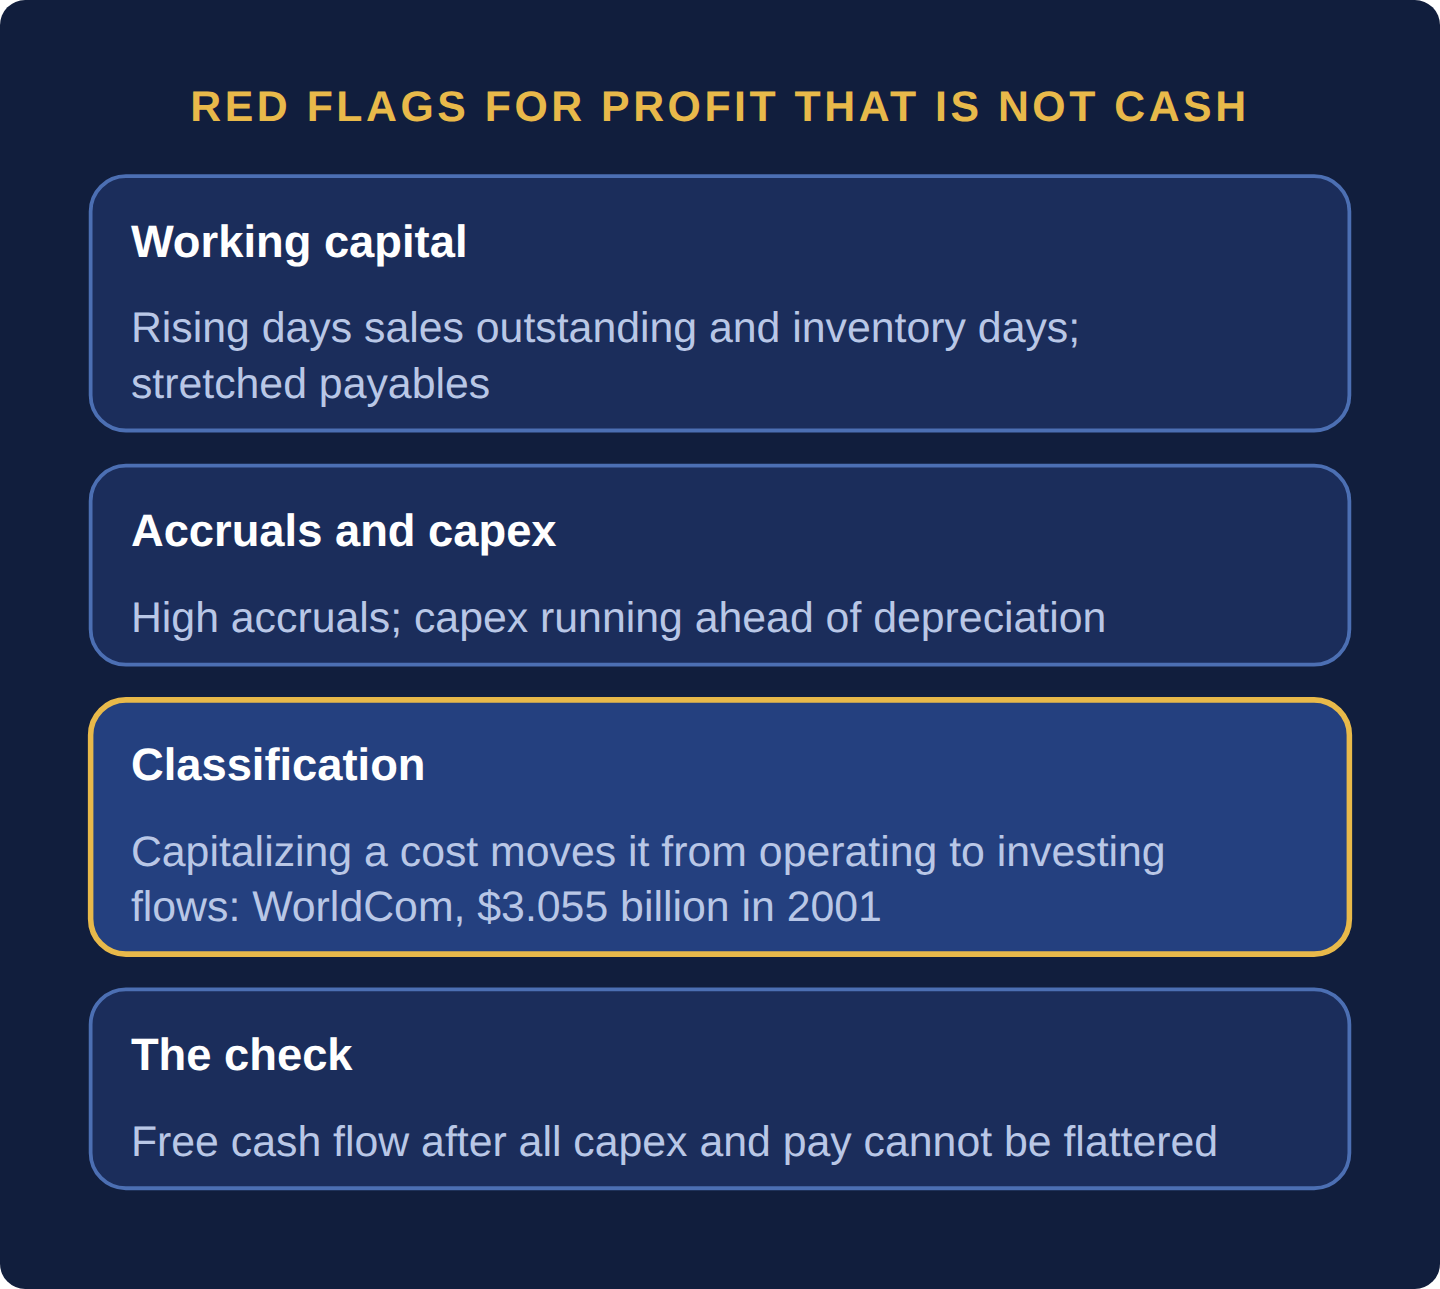
Forensic accounting looks for profit that isn’t turning into cash. The screens are simple: days sales outstanding or inventory days that keep rising, high accruals, capital spending running ahead of depreciation, and stretched payables. Composite scores such as the Beneish M-score combine them into one number. Treat the result as a reason to read the accounts more closely, not as proof of fraud.
Why it matters: A flag tells you where to look, not what you will find.
Summary: Forensic screens look for profit that is not turning into cash: rising days sales outstanding and inventory days, high accruals, capex running ahead of depreciation, and stretched payables. Composite scores such as the Beneish M-score combine them, but they flag cases for reading, not proof of fraud.
- Classification moves cash: capitalizing a cost shifts it from operating to investing flows, as WorldCom did with $3.055 billion of line costs in 2001.
- Free cash flow after all capex and pay is the figure classification cannot flatter.
- The worked company scores −1.49 on the M-score against a −1.78 warning level.
- In the example, $31.5 million of $70 million of operating cash flow came from stretching payables.
- Research supports these screens as triage: accruals are unusually high in years later found misstated.
Beyond the single cash-flow-versus-profit check introduced in Volume I, professional forensic accountants and short-sellers use a specific toolkit of ratios designed to surface exactly the manipulation techniques described above before they are officially disclosed.
| Tool | What It Flags |
|---|---|
| Days Sales Outstanding (DSO) Trend | A sustained rise in DSO (customers taking longer to pay, or receivables growing faster than sales) often signals channel stuffing or deteriorating customer quality |
| Inventory Growth vs Sales Growth | Inventory consistently growing faster than sales can indicate obsolete, unsellable stock being kept on the books rather than written down |
| The Accruals Ratio | The gap between reported net income and operating cash flow, scaled by total assets — high accruals predict less persistent earnings (Sloan, 1996) and are unusually common in years later found misstated |
| The Beneish M-Score | A composite statistical model combining eight financial ratios (including DSO trend, gross margin trend, and asset quality) into a single score designed to flag a heightened probability of earnings manipulation; scores above about −1.78 are the usual warning level |
Operating cash flow (CFO) is harder to fake than profit, but classification can move cash between it and the investing (CFI) and financing sections. Capitalizing a cost moves its outflow from CFO to CFI (the WorldCom fraud below; capitalized development in Part 6.1: GAAP vs IFRS — The Differences That Actually Matter). Selling receivables to a factor pulls collections forward into CFO. Stretching payables or using supplier finance keeps borrowing inside CFO (Part 6.3: Off-Balance-Sheet Financing). Stock-based compensation is added back to CFO as non-cash. None of these changes free cash flow after all capex and pay, which is why it is the anchor.
WorldCom paid other carriers “line costs” for network access, an operating expense. The SEC‘s complaint of June 26, 2002, alleged it transferred $3.055 billion of them into capital accounts in 2001 and $797 million in the first quarter of 2002. Reported 2001 pre-tax income of $2.393 billion becomes $2.393bn − $3.055bn = a loss of $0.662 billion; the 2002 quarter’s $240 million profit becomes $240m − $797m = a $557 million loss. The same entry raised CFO and capex by $3.055 billion each, so free cash flow never changed. The place to look was capex against depreciation and revenue, not the profit-versus-cash gap.
A hypothetical components maker, USD millions, prior year → current year: sales 1,000 → 1,250; cost of goods sold 600 → 790; SG&A 200 → 225; depreciation 50 → 48; net income 80 → 120; CFO 100 → 70; capex 70 → 148; receivables 150 → 260; inventory 120 → 190; payables 90 → 150; current assets 400 → 600; net PP&E 500 → 600; total assets 1,000 → 1,400; current liabilities plus long-term debt 500 → 740. The Beneish M-score (Beneish, 1999) weights eight year-on-year indices:
| Index | Calculation | Value | × weight |
|---|---|---|---|
| DSRI receivables ÷ sales | (260 ÷ 1,250) ÷ (150 ÷ 1,000) | 1.387 | × 0.920 = 1.276 |
| GMI gross margin, prior ÷ current | 40.0% ÷ 36.8% | 1.087 | × 0.528 = 0.574 |
| AQI soft-asset share | (1 − 1,200 ÷ 1,400) ÷ (1 − 900 ÷ 1,000) | 1.429 | × 0.404 = 0.577 |
| SGI sales growth | 1,250 ÷ 1,000 | 1.250 | × 0.892 = 1.115 |
| DEPI depreciation rate, prior ÷ current | (50 ÷ 550) ÷ (48 ÷ 648) | 1.227 | × 0.115 = 0.141 |
| SGAI SG&A ÷ sales | 18.0% ÷ 20.0% | 0.900 | × −0.172 = −0.155 |
| TATA accruals ÷ assets | (120 − 70) ÷ 1,400 | 0.036 | × 4.679 = 0.167 |
| LVGI leverage | (740 ÷ 1,400) ÷ (500 ÷ 1,000) | 1.057 | × −0.327 = −0.346 |
M = −4.84 + 3.349 = −1.49, above the −1.78 cutoff most often quoted from the paper. The working-capital ratios show why. DSO = receivables ÷ sales × 365 rose from 54.8 to 75.9 days: at the old DSO receivables would be $187.5m, so $72.5m of this year’s revenue is uncollected beyond normal. Inventory days rose from 73.0 to 87.8. CFO fell to 0.58× net income, and $31.5m of the $70m CFO came from stretching payables from 54.8 to 69.3 days (790 ÷ 365 × 14.6). Depreciation fell while PP&E grew: at last year’s rate it would be $58.9m, so up to $10.9m of profit may come from a longer useful life (Section 6.6: Inventory and Depreciation Method Choices); asset mix or late-year additions can also lower the rate, so the property note decides. Free cash flow is 70 − 148 = −$78m. Verdict: 50% earnings growth is unconfirmed until the revenue, receivables and PP&E notes explain it.
These screens are triage, not proof. Beneish’s model identified about half of the manipulators in his sample before public discovery. Dechow, Ge, Larson and Sloan (2011), studying 2,190 SEC enforcement releases covering 676 misstating firms, found accruals unusually high in misstatement years, with the change in receivables the strongest single signal. Beneish, Lee and Nichols (2013) found that high M-score stocks underperformed by about 1% a month on a risk-adjusted basis.
If two or more of these fire together, treat earnings as unconfirmed until the notes explain them: DSO up more than about 10 days, CFO below 0.8× net income for two years, capex above 2× depreciation with no announced build-out, DPO up more than 15 days, or an M-score above −1.78. One signal alone is noise, since growth companies trip DSO and capex legitimately; the thresholds are heuristics.
Trusting operating cash flow without asking where it came from. In the workup, $31.5 million of the $70 million CFO, 45%, was a one-time payables stretch; at an assumed 12× CFO multiple, that is $378 million of value that cannot recur. WorldCom’s 2001 CFO was overstated by the full $3.055 billion it capitalized. Value on free cash flow after all capex, with working capital normalized.
What is a good Beneish M-score?
Lower is safer. Scores below about −1.78, the cutoff most often quoted from Beneish’s 1999 paper, suggest a low likelihood of manipulation; a company with stable ratios scores near −2.5. A higher score means read the notes, not fraud: fast honest growth raises the indices too.
What counts as cash flow from investing activities?
Cash spent on or received from long-term assets and investments: capex, capitalized software and development, acquisitions, and securities bought or sold. Spending here does not reduce CFO, so moving an expense into it flatters CFO; compare capex with depreciation and revenue.
What is the accruals ratio?
Net income minus operating cash flow, scaled by total or average assets. It measures how much profit has not yet become cash. Sloan (1996) found high-accrual earnings persist less, which prices did not fully reflect.
Forensic screens test whether profit is turning into cash: DSO, inventory days, the accruals ratio, capex against depreciation, payables days and the Beneish M-score. Cash flow classification can flatter operating cash flow, as WorldCom showed, so free cash flow after all capex and pay is the anchor and the screens are triage, not proof.
Six questions on this chapter. Decide on your answer first, then click “Reveal Answer.”
1. Sales are $600 million and year-end receivables are $90 million. Last year’s days sales outstanding was 40 days. By how much do receivables exceed the level last year’s DSO would imply?
- About $90.0 million
- About $65.8 million
- About $15.0 million
- About $24.2 million
Reveal Answer
Answer: D. At 40 days, receivables would be $600m × 40 ÷ 365 = $65.8m, so the excess is $90m − $65.8m = $24.2m. Current DSO is $90m ÷ $600m × 365 = 54.8 days.
2. Net income is $150 million, operating cash flow $90 million and total assets $2,000 million. What is the accruals ratio on this definition?
- 3.0%
- 1.5%
- 7.5%
- 4.5%
Reveal Answer
Answer: A. ($150m − $90m) ÷ $2,000m = 3.0%. Positive and rising accruals mean profit is running ahead of cash.
3. How did capitalizing line costs change WorldCom’s cash flow statement?
- CFO was unchanged and the cost moved into financing flows
- CFO rose but capex did not, so free cash flow was inflated
- CFO and capex rose equally; free cash flow was unchanged
- CFO fell while reported profit rose by the same amount
Reveal Answer
Answer: C. Moving a cash cost from expense to asset moves its outflow from operating to investing activities, so CFO rises by the same amount as capex. Free cash flow after capex does not move.
4. A company you own scores −1.30 on the Beneish M-score, and its DSO jumped 18 days. What is the sound next step?
- Wait for the auditor’s opinion, which will settle the question
- Treat earnings as unconfirmed and read the revenue notes
- Ignore the score, since only scores below −1.78 signal any risk
- Conclude that the company is committing fraud and sell it now
Reveal Answer
Answer: B. Scores above about −1.78 and a sharp DSO rise are warnings, not proof; the model identified about half of manipulators in its original sample. The notes explain whether growth or manipulation drives the ratios.
5. Worked problem: Receivables are $250m on sales of $1,500m. What are days sales outstanding?
Reveal Answer
Answer: DSO = $250m ÷ $1,500m × 365 = 60.8 days.
6. Worked problem: The prior-year DSO was 45 days. How much of today’s receivables is unexplained by the old collection pattern?
Reveal Answer
Answer: At 45 days, receivables would be $1,500m × 45 ÷ 365 = $184.9m. The excess is $65.1 million, a red flag for revenue pulled forward.
6.8 Famous Cases as Pattern Templates
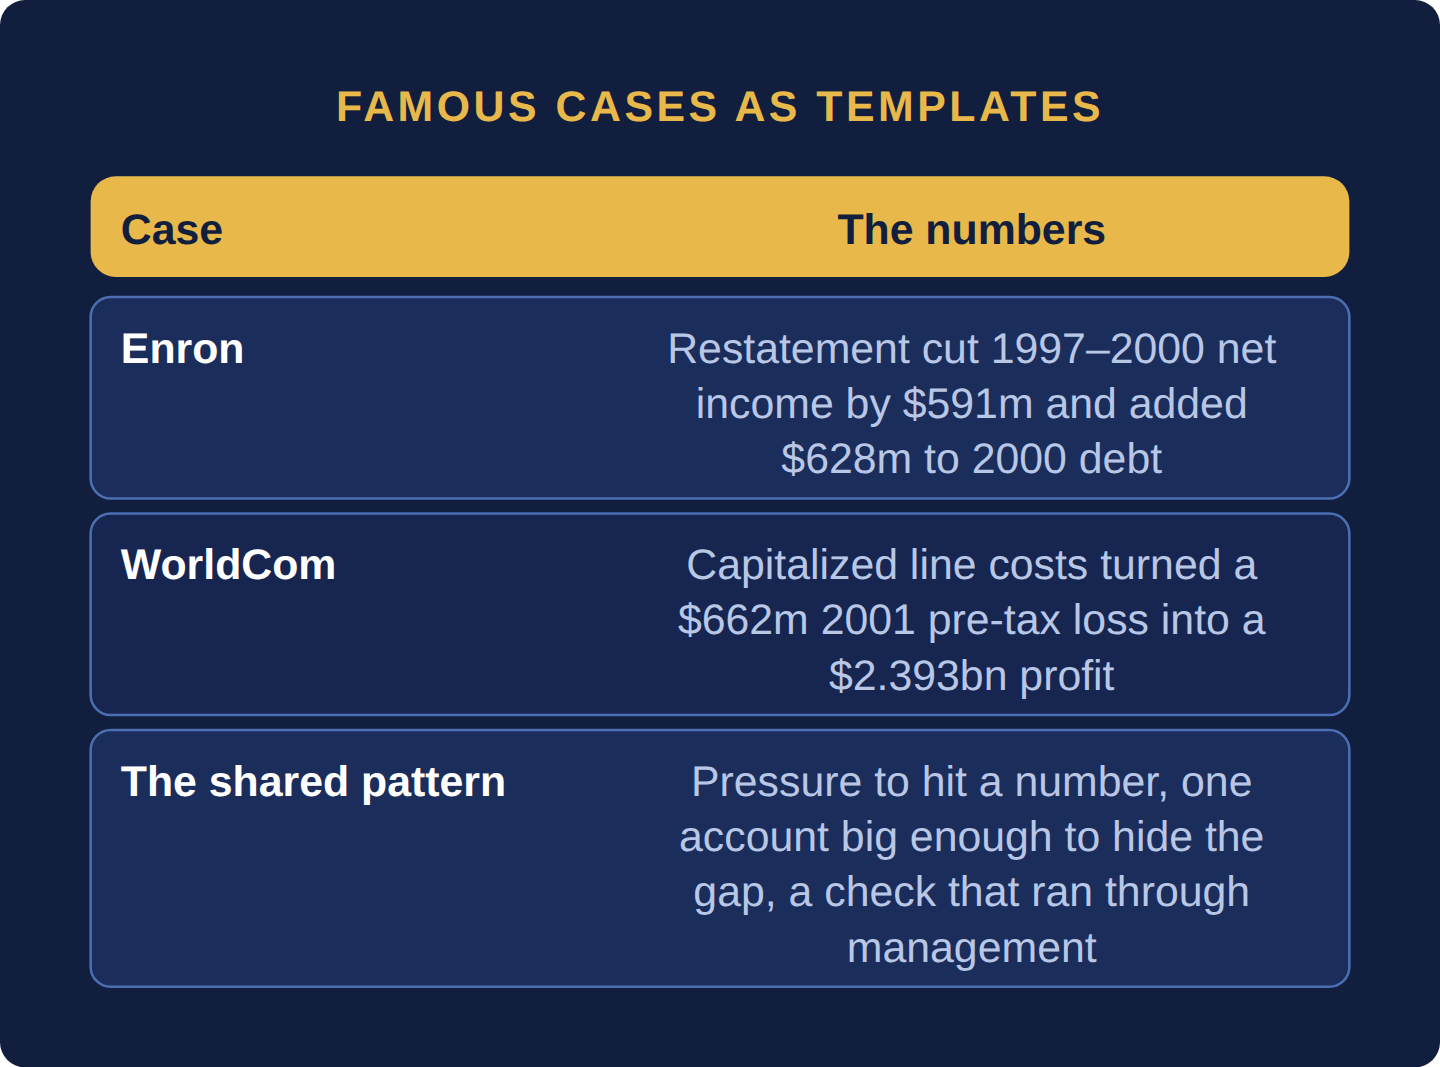
Enron, WorldCom, Satyam and Wirecard used different accounts, partnerships and tricks with capital spending and cash, yet they share one pattern. There was pressure to hit a number, one account big enough to hide the gap, and a check that ran through management instead of being independent. Learn the pattern and you can spot the next case even when the details look new.
Why it matters: Frauds differ in detail but follow the same structure.
Summary: Enron, WorldCom, Satyam and Wirecard used different accounts, partnerships, capex and cash, but share a pattern: pressure to hit a number, one account big enough to hide the gap, and a check that ran through management instead of being independent.
- Enron’s restatement cut 1997–2000 net income by $591 million and added $628 million to 2000 debt.
- WorldCom’s capitalized line costs turned a $662 million 2001 pre-tax loss into a $2.393 billion profit.
- ₹5,040 crore of Satyam’s ₹5,361 crore cash and bank balances did not exist.
- Wirecard’s €1.9 billion of trust-account cash failed audit confirmation in June 2020.
- For each case, name the account, the ratio that moved and the control that was not independent.
Four well-documented cases, studied here for their repeating structural pattern, illustrate how these techniques combine in practice.
| Case | What was faked, in numbers | The test that points at it |
|---|---|---|
| Enron (2001) | Partnerships that did not qualify to stay off the balance sheet (Chewco, JEDI, the CFO-run LJM1). The November 8, 2001, restatement cut 1997–2000 net income by $591 million (2000: $979m → $847m) and added $628 million to 2000 debt; bankruptcy followed in December 2001 | Consolidation and guarantees (6.3, 6.4): who absorbs the entity’s losses, and who runs the counterparty |
| WorldCom (2002) | Line costs capitalized as assets: $3.055 billion in 2001 and $797 million in the first quarter of 2002, turning a $662 million 2001 pre-tax loss into a reported $2.393 billion profit | Capex against depreciation and revenue; free cash flow rather than CFO (6.7) |
| Satyam (2009) | Fake cash: the chairman’s January 7, 2009, letter admitted ₹5,040 crore of the ₹5,361 crore cash and bank balances did not exist, and that quarterly revenue of ₹2,700 crore was really ₹2,112 crore; the SEC counted more than $1 billion of fictitious cash and over 6,000 fake invoices | Bank confirmations sent and received by the auditor, never through management |
| Wirecard (2020) | €1.9 billion of cash said to sit in trustee accounts; on June 18, 2020, the auditor could not verify it, on June 22 the board said it most likely did not exist, and on June 25 the company filed for insolvency | Independent confirmation of cash held by third parties; revenue routed through partners no one can see |
Read side by side, the four share a structure. Each began as a way to report better numbers than the business produced (the SEC said WorldCom’s aim was to meet analysts’ estimates). Each needed one balance-sheet account big enough to absorb the fiction: unconsolidated partnerships at Enron, PP&E at WorldCom, cash at Satyam and Wirecard. Each survived because a check that should have been independent ran through management: Enron’s partnerships were run by its own chief financial officer, and at Satyam and Wirecard the cash confirmations the auditors relied on were not properly obtained or were spurious. The SEC found that PwC’s Indian affiliates failed to carry out third-party confirmation procedures on Satyam’s cash and receivables, and fined them $6 million in April 2011; Satyam paid $10 million. The lesson for a reader of accounts: the test that matters is the one the company cannot route through itself. The less dramatic cases elsewhere in this Part, Groupon’s gross revenue (6.2) and Carillion’s supplier finance (6.3), fit the same template at lower intensity.
A reading rule for case studies: for each case, name the account that absorbed the fiction, the ratio that would have moved, and the check that was not independent. Use cases to choose which tests to run on a live company, not to predict which company is next; frauds rarely repeat the last one’s account. And do not read every red flag as fraud: most high-accrual, high-DSO companies are growing or struggling, not cheating.
Treating a reported cash balance as self-verifying. Satyam’s books showed ₹5,361 crore of cash and bank balances on September 30, 2008, of which ₹5,040 crore, 94%, did not exist; Wirecard’s €1.9 billion was about to be written off as never having existed. In both, the cash looked like the safest asset on the balance sheet. When cash is large relative to revenue, held with third parties you cannot see, or sits beside fresh borrowing, ask whether the auditor confirmed it directly with the bank.
What did Enron actually do wrong in its accounts?
It kept entities off its balance sheet that did not qualify. Its November 2001 filing conceded that Chewco had never met the criteria for an unconsolidated special purpose entity, so Chewco and JEDI had to be consolidated back to 1997, and that its CFO had run the LJM partnerships that dealt with Enron, earning more than $30 million. The restatement cut 1997–2000 net income by $591 million and added $628 million to 2000 debt.
How was the Wirecard fraud discovered?
Through a failed audit confirmation. On June 18, 2020, Wirecard announced that its auditor, EY, could not obtain sufficient evidence for €1.9 billion of trust-account cash and had seen indications of spurious balance confirmations. Four days later the board said the money most likely did not exist, and on June 25 the company applied for insolvency.
Can forensic ratios detect fraud before it is public?
Sometimes, as a probability rather than a verdict. Beneish’s 1999 model identified about half of the manipulators in his sample before discovery. Ratios catch income-statement fictions that leave traces in receivables, accruals or capex; they struggle with fake cash, which needs confirmation outside the company.
The rulebook. Indian companies above a size threshold report under Ind AS, IFRS with a few local carve-outs, under the Companies (Indian Accounting Standards) Rules, 2015, notified on February 16, 2015, and mandatory from April 1, 2016, for companies with net worth of ₹500 crore or more, then for all listed companies from April 1, 2017. So everything this Part says about IFRS applies: Ind AS 115 uses the five-step revenue model (6.2); Ind AS 116, in force from April 1, 2019, lifts EBITDA exactly as IFRS 16 does (6.3), so lease-heavy companies reported higher EBITDA from 2019–20 for the same cash; Ind AS 12 recognizes deferred tax assets only when probable, with no valuation allowance (6.5); and Ind AS 2 bans LIFO (6.6). The rupee version of this Part’s goodwill example: pay ₹1,200 crore for identifiable net assets of ₹850 crore and goodwill is ₹1,200 − ₹850 = ₹350 crore; if a later test supports only ₹200 crore, ₹150 crore is written off through profit.
The referees. The Institute of Chartered Accountants of India (ICAI) drafts standards and disciplines its members; the National Financial Reporting Authority (NFRA), constituted on October 1, 2018, under section 132 of the Companies Act, 2013, recommends standards to the government and oversees the auditors of listed and large companies. In July 2020 NFRA debarred the Deloitte engagement partner on IL&FS Financial Services’ 2017–18 audit for seven years and fined him ₹25 lakh. SEBI acts on the company side. It barred Price Waterhouse network firms from auditing listed companies for two years over Satyam in January 2018; in September 2019 the Securities Appellate Tribunal set the ban aside, holding that audit quality is for ICAI, while upholding disgorgement of about ₹13 crore of fees. In April 2025 SEBI found that of ₹977.75 crore borrowed by Gensol Engineering from IREDA and PFC, ₹663.89 crore was for 6,400 electric vehicles, yet only 4,704 were bought and ₹262.13 crore was unaccounted; it barred the promoters from directorships and ordered a forensic audit. The forensic lesson matches 6.7: follow capex to the assets actually delivered.
Enron, WorldCom, Satyam and Wirecard hid their gaps in different accounts but shared one pattern: pressure to meet a number, an account large enough to absorb the fiction, and a check that ran through management. Reading cases this way tells you which tests to run, including direct confirmation of cash.
Six questions on this chapter. Decide on your answer first, then click “Reveal Answer.”
1. Satyam’s books showed ₹5,361 crore of cash and bank balances on September 30, 2008, and its chairman admitted ₹5,040 crore did not exist. What share was fictitious?
- About 94%
- About 60%
- About 50%
- About 78%
Reveal Answer
Answer: A. ₹5,040 crore ÷ ₹5,361 crore = 94%. The SEC described it as more than $1 billion of fictitious cash, about half of total assets.
2. WorldCom reported 2001 pre-tax income of $2.393 billion. The SEC alleged $3.055 billion of line costs had been capitalized that year. What was the true pre-tax result?
- A loss of about $3.06 billion
- A loss of about $0.66 billion
- A profit of about $0.66 billion
- A profit of about $5.45 billion
Reveal Answer
Answer: B. $2.393bn − $3.055bn = −$0.662bn. Expensing the costs turns the reported profit into a loss.
3. According to the SEC’s 2011 action, which audit procedure failed at Satyam?
- Physical counts of inventory held at its warehouses
- Board approval of large related-party acquisitions
- Review of the company’s annual tax computations
- Third-party confirmation of cash and receivables
Reveal Answer
Answer: D. The SEC found PwC’s Indian affiliates failed to carry out confirmation procedures on Satyam’s cash and receivables, and fined them $6 million.
4. What did Enron’s November 8, 2001, restatement concede?
- Cash said to sit in trustee accounts never existed
- Network line costs had been capitalized, not expensed
- Chewco and JEDI had to be consolidated, adding debt
- Energy trading revenue had been booked gross, not net
Reveal Answer
Answer: C. Enron restated 1997–2000 to consolidate Chewco and JEDI, cutting net income by $591 million and adding $628 million to 2000 debt.
5. Worked problem: WorldCom’s capitalized line costs added $3.055bn to 2001 profit, turning a reported $2.393bn pre-tax profit from what underlying result?
Reveal Answer
Answer: $2.393bn − $3.055bn = −$0.662bn, a $662m pre-tax loss.
6. Worked problem: Enron’s restatement cut 1997–2000 net income by $591m. What is the average cut per year?
Reveal Answer
Answer: $591m ÷ 4 = $147.75m a year.
- SEC v. WorldCom, complaint (June 26, 2002) — $3.055bn (2001) and $797m (Q1 2002) of capitalized line costs; true results
- Beneish, “The Detection of Earnings Manipulation,” Financial Analysts Journal (1999)
- Enron Form 8-K (Nov 8, 2001) — Restatement: −$591m net income 1997–2000, +$628m debt 2000; Chewco, JEDI, LJM
- B. Ramalinga Raju letter to the Satyam board (Jan 7, 2009), SEC exhibit — ₹5,040 crore of ₹5,361 crore cash non-existent (6.8, India Lens)
- SEC press release 2011-81 (Satyam)
- 2011-82 (PwC India)
- SEC Litigation Release 17588 (WorldCom, June 27, 2002)