
C.15 The Head of Regulatory Capital & Reporting
A bank is allowed to grow only as far as its capital allows. The Head of Regulatory Capital and Reporting turns every exposure the bank has into risk-weighted assets, meaning each loan or holding is counted by how risky it is. Then they report the capital ratios to regulators. That ratio caps how far the bank can grow, pay dividends or buy back its own shares.
Why it matters: One ratio decides how big the bank can get and how much it can pay out.
Summary: The Head of Regulatory Capital and Reporting turns every bank exposure into risk-weighted assets and reports capital ratios to regulators. The ratio caps how far the bank can grow, pay dividends or buy back stock.
- RWA = exposure × credit conversion factor × risk weight, plus market-risk RWA.
- US minimums: 4.5% CET1, 6% Tier 1, 8% total capital, plus buffers.
- Each new $2bn corporate loan needs about $150m of CET1 at a 7.5% requirement.
- The US Basel III endgame was still a proposal as of October 2026.
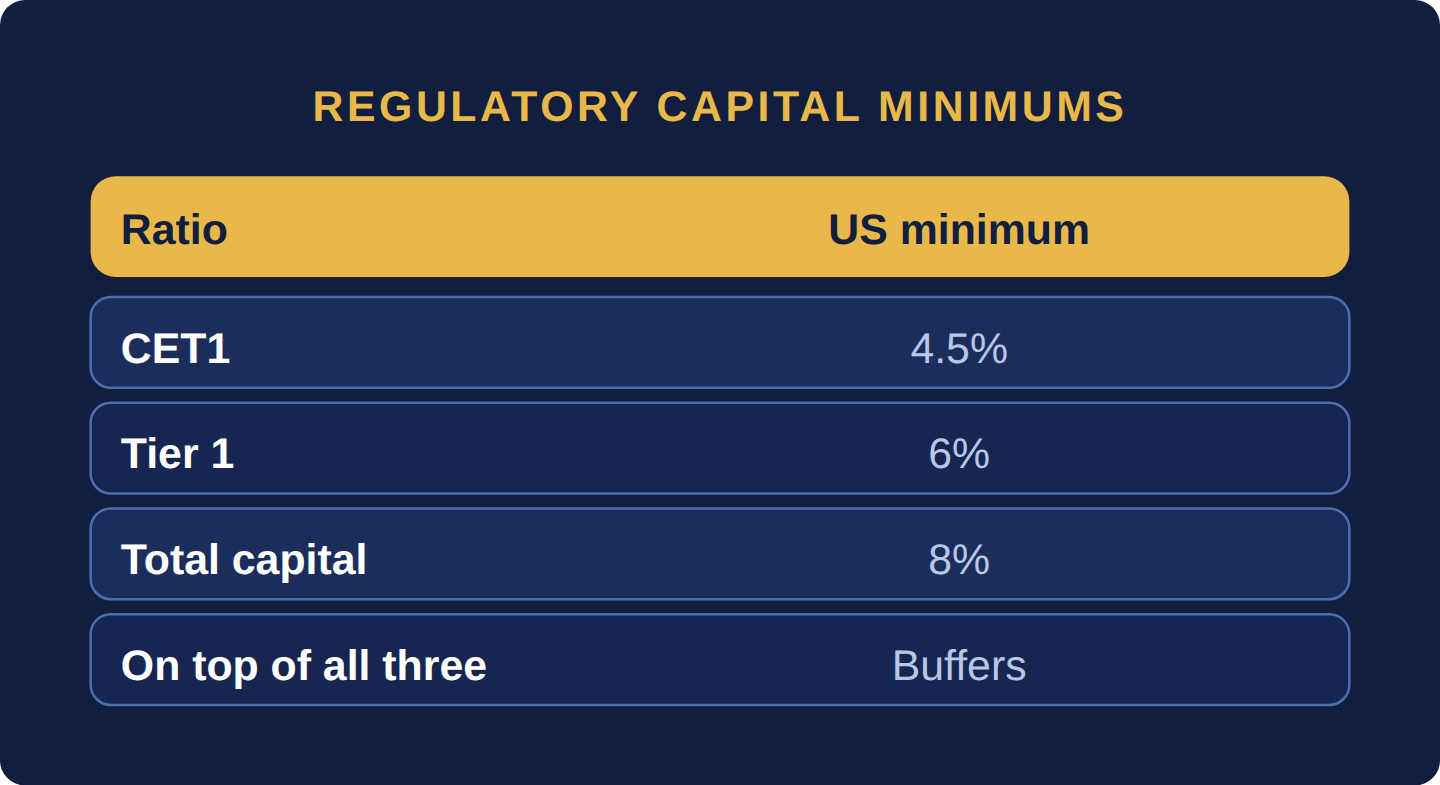
This role owns the bank’s regulatory capital calculations and the regulatory submissions that follow from them. Basel III, the global standard set by the Basel Committee on Banking Supervision, reaches US banks through the capital rules of the Federal Reserve, the OCC and the FDIC: every exposure is converted into risk-weighted assets (RWA), and capital divided by RWA gives ratios that must stay above minimums plus buffers. Few other firm types hold capital against risk-weighted assets in this formulaic way, so the function is centered on banks and bank-like lenders such as India’s NBFCs.
| Cadence | What Actually Happens |
|---|---|
| Daily/Weekly | Monitoring trading-book (market-risk) RWA and large new exposures against internal capital limits |
| Monthly | Calculating RWA and capital ratios by business line, explaining the month’s movements, and comparing them with the capital plan |
| Quarterly | Filing the capital schedules of the quarterly regulatory reports (the Call Report for the bank, the FR Y-9C for the holding company), presenting the capital position to the CFO and the board’s risk committee |
| Annually | Running the capital plan submission (annual for US holding companies with $100 billion or more of assets) and the data behind the Federal Reserve’s stress test, which sets the stress capital buffer and runs every year for the largest firms and every other year for most firms with $100 billion to $250 billion of assets (Category IV), planning capital issuance, dividends or buybacks against projected ratios |
A bank’s ability to grow its balance sheet at all is directly capped by its capital ratio — this function isn’t simply a reporting exercise, it’s one of the tightest real constraints on the CFO’s strategic options at any given moment.
Under the US standardized approach the build runs in four steps: map each exposure to its regulatory category, convert off-balance-sheet items into exposure with a credit conversion factor (CCF), multiply by the risk weight the rule assigns, then add market-risk RWA and divide common equity tier 1 (CET1) capital by the total. An illustrative bank:
| Exposure | Amount | CCF | Risk weight | RWA |
|---|---|---|---|---|
| US Treasuries | $20.0bn | n/a | 0% | $0 |
| Qualifying first-lien residential mortgages | $30.0bn | n/a | 50% | $15.0bn |
| Corporate loans | $40.0bn | n/a | 100% | $40.0bn |
| Undrawn corporate commitments, original maturity over one year | $10.0bn | 50% | 100% | $5.0bn |
| Market-risk RWA from the trading book (given) | $6.0bn | |||
| Total RWA | $66.0bn |
CET1 ratio = CET1 capital ÷ RWA = $7.5bn ÷ $66.0bn = 11.36%.
Requirement = 4.5% minimum + 3.0% stress capital buffer (assumed; the floor is 2.5%) = 7.5%. Required CET1 = 7.5% × $66.0bn = $4.95bn, so headroom = $7.5bn − $4.95bn = $2.55bn. At an assumed 8.5% management target, the bank can carry at most $7.5bn ÷ 8.5% = $88.2bn of RWA.
What the business sees: a new $2bn corporate loan adds $2bn of RWA, needs 7.5% × $2bn = $150m of CET1, and moves the ratio to $7.5bn ÷ $68.0bn = 11.03%. That $150m, charged at the bank’s cost of equity, is why the capital team sits in loan-pricing debates. Before filing, the team reconciles every exposure to the general ledger and explains each material RWA movement since the last quarter.
| Question | Typical answer |
|---|---|
| Entry titles | Regulatory Reporting Analyst, Capital Analyst or RWA Analyst, often through a bank’s finance graduate program. |
| The ladder (typical years) | Analyst (0–3) → Senior Analyst or AVP (3–6) → Vice President or Manager (6–10) → Director, Capital Reporting (10–15) → Head of Regulatory Capital and Reporting (15+). |
| Qualifications that help | CPA or CA is common, because the numbers must tie to the ledger. FRM is optional and helps with the risk models; CFA is optional. SQL and Python are increasingly expected. |
| Where people come from | Big 4 bank audit, financial control, product control (E.7: Product Control) and risk analytics. |
| Where people go next | Treasury and ALM (E.9: Treasury and Asset-Liability Management (ALM)), capital planning, CFO of a bank subsidiary, a regulator, or regulatory consulting. |
| Relative pay tier (1 lowest to 5 highest) | Entry: 2; Senior: 4. Larger, more complex banks and stress-testing experience push it up. |
| Who fits | People who read rules closely and enjoy making numbers reconcile. Those who dislike hard quarterly deadlines and repeated regulator questions burn out. |
| What interviewers ask | Compute RWA for a loan with an undrawn commitment; the difference between CET1, Tier 1 and total capital; what a ratio fall means for dividends; how you reconcile a regulatory report to the general ledger. |
Reports to: the CFO, in very close and continuous coordination with the CRO, since capital and risk are two sides of the same regulatory requirement.
Typical direct reports: Regulatory Reporting Managers by jurisdiction, and Capital Planning Analysts.
Key interactions:
- Chief Risk Officer (C.7: The Chief Risk Officer) — RWA calculations depend directly on the risk models the CRO’s team maintains; the two functions effectively co-produce the capital number together.
- Controller (C.1: The Controller) — regulatory capital reporting draws on the same underlying ledger data as financial reporting, reconciled to a different rulebook.
- Treasurer (C.2: The Treasurer) — capital ratio constraints directly shape how much balance sheet growth, buyback, or dividend capacity Treasury actually has room to execute.
Outside finance: business line heads (capital is allocated to, and constrains, each business line’s growth), and the regulator itself, with whom this role has direct, frequent contact.
Core systems: regulatory calculation and reporting platforms (Nasdaq AxiomSL is widely used) or in-house engines, the data warehouse that feeds them, and regulator submission portals.
What does the Head of Regulatory Capital and Reporting do?
Turns every bank exposure into risk-weighted assets and reports capital ratios to regulators.
How are risk-weighted assets calculated?
RWA = exposure × credit conversion factor × risk weight, plus market-risk RWA.
What are the US minimum ratios?
4.5% CET1, 6% Tier 1 and 8% total capital, plus buffers.
The Head of Regulatory Capital turns every exposure into risk-weighted assets and reports ratios. US minimums are 4.5% CET1, 6% Tier 1 and 8% total capital, plus buffers.
Six questions on this chapter. Decide on your answer first, then click “Reveal Answer.”
1. A bank has $10bn of undrawn corporate commitments with original maturity over one year (50% CCF, 100% risk weight). What RWA results?
- $5.0bn
- $10.0bn
- $0.5bn
- $2.0bn
Reveal Answer
Answer: A. RWA = $10bn × 50% × 100% = $5.0bn.
2. A bank holds $7.5bn of CET1 against $66bn of RWA. What is its CET1 ratio?
- 8.80%
- 7.50%
- 12.50%
- 11.36%
Reveal Answer
Answer: D. CET1 ratio = $7.5bn ÷ $66bn = 11.36%.
3. With a 7.5% CET1 requirement, how much CET1 does a new $2bn corporate loan at a 100% risk weight need?
- $90 million
- $15 million
- $150 million
- $200 million
Reveal Answer
Answer: C. RWA added = $2bn × 100% = $2bn; CET1 needed = 7.5% × $2bn = $150 million.
4. What was the status of the US Basel III endgame rules in early October 2026?
- Finalized in September 2026, phasing in
- Re-proposed in March 2026, not yet final
- Finalized in July 2023, now in force
- Withdrawn in 2025 with no replacement
Reveal Answer
Answer: B. The agencies issued new proposals on March 19, 2026, with comments due June 18, 2026; no final rule had been issued by October 5, 2026.
5. Worked problem: An undrawn commitment of $100m has a credit conversion factor of 50% and a 100% risk weight. What is the risk-weighted exposure?
Reveal Answer
Answer: $100m × 50% × 100% = $50m of RWA.
6. Worked problem: With $3m of CET1 supporting that and $50m of other RWA, what is the CET1 ratio?
Reveal Answer
Answer: 3 ÷ (50 + 50) = 3.0%, below the 4.5% minimum.
C.16 The Head of Investment Management
An insurer collects money now and pays claims years later, so someone must invest it wisely. The Head of Investment Management, often called the CIO, invests the portfolio to match the length and timing of the policy promises. They typically report to the CEO and work within an investment policy statement, or IPS, approved by the board’s investment committee.
Why it matters: The investments must be chosen to fit the promises, not just to earn the most.
Summary: The insurer’s Head of Investment Management, often the CIO, invests the portfolio against the duration and cash flows of policy liabilities. The CIO typically reports to the CEO and works within an IPS approved by the board’s investment committee.
- The duration gap is DA − (L ÷ A) × DL.
- A negative gap means falling rates shrink surplus.
- The ALM report goes monthly to the CFO and quarterly to the investment committee.
- In India, IRDAI requires a board Investment Committee.

This role, often titled Chief Investment Officer (CIO), manages the insurer’s investment portfolio, often the company’s single largest asset, matched deliberately in duration and cash flow against the policy liabilities the Chief Actuary estimates (C.11: The Chief Actuary). Its core report is the asset-liability management (ALM) report, and its rulebook is the investment policy statement (IPS) that the board’s investment committee approves.
| Cadence | What Actually Happens |
|---|---|
| Daily/Weekly | Monitoring portfolio performance and market risk against investment policy limits |
| Monthly | Producing the ALM report (asset and liability durations, the duration gap, cash-flow matching by year, surplus impact of rate shocks) and reporting investment income to the CFO |
| Quarterly | Presenting strategy, performance, limit breaches and the ALM position to the investment committee and board |
| Annually | Reviewing and updating the strategic asset allocation and the investment policy statement |
An insurer’s investment portfolio isn’t managed purely for return the way a typical institutional portfolio would be — a duration mismatch against the reserve liabilities is itself a solvency risk, so this role’s mandate is constrained by the actuarial liability profile in a way few other institutional investors ever face.
The ALM report shows how much the assets and the liabilities move when interest rates move. Its key line is the duration gap, using modified durations: DGAP = DA − (L ÷ A) × DL. An illustrative life insurer:
| Item | Value |
|---|---|
| Assets at market value (A) | $12.0bn, duration 6.5 |
| Liabilities, present value of policy cash flows (L) | $10.5bn, duration 8.0 |
| Surplus (A − L) | $1.5bn |
Gap: 6.5 − (10.5 ÷ 12.0) × 8.0 = 6.5 − 7.0 = −0.5 years.
Rates fall 1 percentage point: assets gain 6.5 × $12.0bn × 0.01 = $780m; liabilities grow 8.0 × $10.5bn × 0.01 = $840m; surplus falls $60m (check: −DGAP × A × Δy = −(−0.5) × $12.0bn × (−0.01) = −$60m), from $1.5bn to $1.44bn, a 4% loss.
The fix: closing the gap needs 0.5 × $12.0bn = $6.0bn of extra duration-weighted assets. Selling 3-year bonds (duration 2.8) to buy 20-year bonds (duration 13.0) does it with $6.0bn ÷ (13.0 − 2.8) = $0.59bn of trades. The CIO sizes the trade against credit limits, capital charges and the cash Claims needs, and takes it to the investment committee if it changes the strategic allocation.
The investment committee and the IPS. The investment policy statement (IPS) sets the objectives (pay claims, earn a spread over rates credited to policyholders), the permitted assets, limits by asset class, rating, issuer and liquidity, the duration-gap tolerance, and who approves exceptions. The board’s investment committee approves it, reviews the ALM report each quarter and rules on breaches; the CIO executes within it. In India the committee is a regulatory requirement (see the India Lens at the end of Part C).
| Question | Typical answer |
|---|---|
| Entry titles | Investment Analyst, Portfolio Analyst, ALM Analyst or Investment Accounting Analyst at an insurer. |
| The ladder (typical years) | Investment Analyst (0–3) → Senior Analyst or Associate Portfolio Manager (3–6) → Portfolio Manager (6–10) → Head of Fixed Income or Head of ALM (10–15) → Chief Investment Officer (15+). |
| Qualifications that help | The CFA charter is common. An actuarial fellowship (SOA’s FSA, or IAI in India) is common in ALM seats. CAIA is optional for alternatives; FRM is optional. |
| Where people come from | Fixed-income teams at asset managers, actuarial and ALM teams, rating agencies and bank treasury. |
| Where people go next | CIO of a larger insurer, insurance-solutions teams at asset managers, pension-fund CIO, and occasionally insurer CEO. |
| Relative pay tier (1 lowest to 5 highest) | Entry: 3; Senior: 5. The size of the portfolio and a record in private credit and alternatives move it. |
| Who fits | Patient, long-horizon investors who accept that liabilities set the rules. Return-maximizers who chafe at limits burn out. |
| What interviewers ask | Compute a duration gap and its surplus impact; build an allocation for an annuity block; pick between two bonds after capital charges; explain a limit breach to a committee. |
Reports to: typically the CEO, sometimes the CFO. Either way the CIO invests within limits set by the board’s investment committee, which approves the IPS and reviews the ALM position; at insurers that outsource most of the portfolio, the role is often a CFO report overseeing external managers.
Typical direct reports: Portfolio Managers by asset class (fixed income, equities, alternatives), and an Investment Risk Analyst.
Key interactions:
- Chief Actuary (C.11: The Chief Actuary) — the defining relationship of this role: the portfolio’s duration profile must track the reserve liabilities’ duration, requiring constant coordination between the two.
- Controller (C.1: The Controller) — investment income and unrealized gains/losses flow directly into the close.
- Head of Regulatory & Solvency Reporting — portfolio composition is a direct input to solvency capital calculations.
Outside finance: external asset managers (where portions of the portfolio are managed externally), Claims (near-term liquidity needs for large claim payments).
Core systems: portfolio management systems (Aladdin, Clearwater Analytics), investment accounting platforms.
Who invests an insurer’s portfolio?
The Head of Investment Management, often the CIO, against the duration and cash flows of policy liabilities.
What is the duration gap?
DA − (L ÷ A) × DL.
What does a negative duration gap mean?
Falling rates shrink surplus.
Global capability centers (GCCs) in Bengaluru, Hyderabad, Pune, Chennai and Gurugram run much of the volume work behind Part C for global parents: record-to-report and reconciliations for the Controller (C.1: The Controller), forecasting support for FP&A (C.3: The Head of FP&A), tax compliance (C.6: The Tax Director), NAV checks (C.12: The Head of Fund Accounting), valuation support (C.13: The Head of Portfolio Valuation), surveillance alerts and personal-trading reviews (C.14: The Chief Compliance Officer), RWA data and report production (C.15: The Head of Regulatory Capital & Reporting) and investment accounting (C.16: The Head of Investment Management). The typical split: preparation and first review move to India; sign-off, regulator contact and judgment calls stay with the onshore owner. A GCC career therefore tends to top out at site or process leadership unless you move into a global role.
The Indian qualifications that map to these seats:
- CA (Institute of Chartered Accountants of India): the default for controllership, tax, audit and fund accounting.
- CMA (Institute of Cost Accountants of India): costing, FP&A and plant finance.
- CS (Institute of Company Secretaries of India): a listed company’s compliance officer must be a qualified company secretary under SEBI’s listing rules.
- FRM (GARP) and CFA (CFA Institute): risk, regulatory capital, valuation and investment seats.
- Fellowship of the Institute of Actuaries of India (a statutory body under the Actuaries Act, 2006): required for an insurer’s Appointed Actuary.
Indian regulators write several Part C roles into rules:
- Treasurer: foreign-currency borrowing runs under RBI’s Master Direction on External Commercial Borrowings, Trade Credits and Structured Obligations.
- Chief Compliance Officer: RBI requires a bank’s CCO to serve a fixed tenure of at least three years, report directly to the MD & CEO and/or the board or its audit committee, carry no business targets, and bring at least 15 years in banking or financial services. IRDAI sets the same minimum three-year tenure for insurers’ CCOs. Under SEBI’s Mutual Funds Regulations, 2026, an asset management company’s CEO and CCO are accountable for the mechanism that deters front-running, the Indian counterpart of the personal-trading review.
- Examinations: SEBI’s counterpart of an SEC exam is an inspection under the Intermediaries Regulations, 2008: an inspecting authority, usually after notice, examines books, records and internal controls and reports to SEBI, which decides on action.
- Regulatory capital and reporting: RBI applies Basel III to commercial banks through its own capital regulations, which the bank’s regulatory reporting team calculates and files.
- Investment management: IRDAI’s Corporate Governance Regulations, 2024 require each insurer’s board to form an Investment Committee that recommends the investment policy. The Actuarial, Finance and Investment Functions Regulations, 2024, which replaced the Investment Regulations, 2016, require a board-approved investment policy covering asset-liability mismatch, implemented by the committee and monitored by the board quarterly.
Fund Accounting (C.12: The Head of Fund Accounting) strikes and checks NAV, and Portfolio Valuation (C.13: The Head of Portfolio Valuation) defends Level 3 marks before a valuation committee. The Chief Compliance Officer (C.14: The Chief Compliance Officer) tests the firm’s conduct from outside finance, Regulatory Capital and Reporting (C.15: The Head of Regulatory Capital & Reporting) turns exposures into RWA and capital ratios, and Investment Management (C.16: The Head of Investment Management) keeps an insurer’s assets matched to its liabilities through the duration gap and the investment committee.
Six questions on this chapter. Decide on your answer first, then click “Reveal Answer.”
1. An insurer has $12bn of assets (duration 6.5) and $10.5bn of liabilities (duration 8.0). What is its duration gap?
- −0.5 years
- −1.5 years
- +1.5 years
- +0.5 years
Reveal Answer
Answer: A. DGAP = 6.5 − (10.5 ÷ 12) × 8.0 = 6.5 − 7.0 = −0.5 years.
2. With a duration gap of −0.5 on $12bn of assets, what happens to surplus if rates fall 1 percentage point?
- It falls by about $780 million
- It rises by about $60 million
- It falls by about $60 million
- It rises by about $840 million
Reveal Answer
Answer: C. ΔSurplus ≈ −DGAP × A × Δy = −(−0.5) × $12bn × (−0.01) = −$60 million.
3. To whom does an insurer’s CIO most often report?
- The audit committee, sometimes Legal
- The CEO, sometimes the CFO
- The Controller, sometimes the Treasurer
- The Chief Actuary, sometimes the CRO
Reveal Answer
Answer: B. The CIO is typically a CEO report, sometimes a CFO report, and invests within limits set by the board’s investment committee.
4. Which body approves an insurer’s investment policy statement and rules on breaches?
- The external auditor’s engagement team
- The CIO’s portfolio management desk
- The claims department’s reserving team
- The board’s investment committee
Reveal Answer
Answer: D. The investment committee approves the IPS, reviews the ALM report and rules on breaches; the CIO executes within it.
5. Worked problem: An insurer’s assets have duration 6 and are $1,000m; liabilities are 90% of assets with duration 7. What is the duration gap?
Reveal Answer
Answer: Gap = 6 − 0.9 × 7 = -0.3, negative.
6. Worked problem: Rates fall 1 point. What happens to surplus?
Reveal Answer
Answer: Surplus change ≈ −gap × assets × Δy = −(-0.3) × $1,000m × (−1%) = -3.0m: falling rates shrink surplus.
- Federal Reserve, Mar 19, 2026
- Federal Reserve, Sep 30, 2026
- 12 CFR Part 217
- RBI, Compliance functions in banks and role of the CCO (Sep 11, 2020)
- RBI, Basel III Capital Regulations: review of transitional arrangements (Sep 29, 2020)
- RBI, Master Direction on ECB (updated Sep 8, 2026)
- IRDAI, gazette-notified regulations (Corporate Governance, and Actuarial, Finance and Investment Functions, 2024)
- SEBI, Mutual Funds Regulations, 2026