
5.3 The Capital Market Line & the Market Portfolio
Add a safe asset like cash to the menu, and the curved frontier becomes a straight line, the Capital Market Line. It runs from the risk-free rate to one special portfolio, the market portfolio. Every investor then picks that one risky portfolio and mixes it with cash or borrowing to set their level of risk, which is the theory behind index funds. Tracking error and active share measure how far a fund strays from its index, and the evidence that most active funds trail their index after costs is strong.
Why it matters: The line explains why a simple index fund plus cash can be a complete plan.
Summary: Adding a risk-free asset turns the curved frontier into a straight line, the Capital Market Line, from the risk-free rate through the tangency (market) portfolio. Investors then choose risk by mixing that one portfolio with cash or borrowing, which is the theoretical case for index funds. Tracking error and active share measure how far a fund strays from its index, and the evidence that most active funds trail their index after costs is strong.
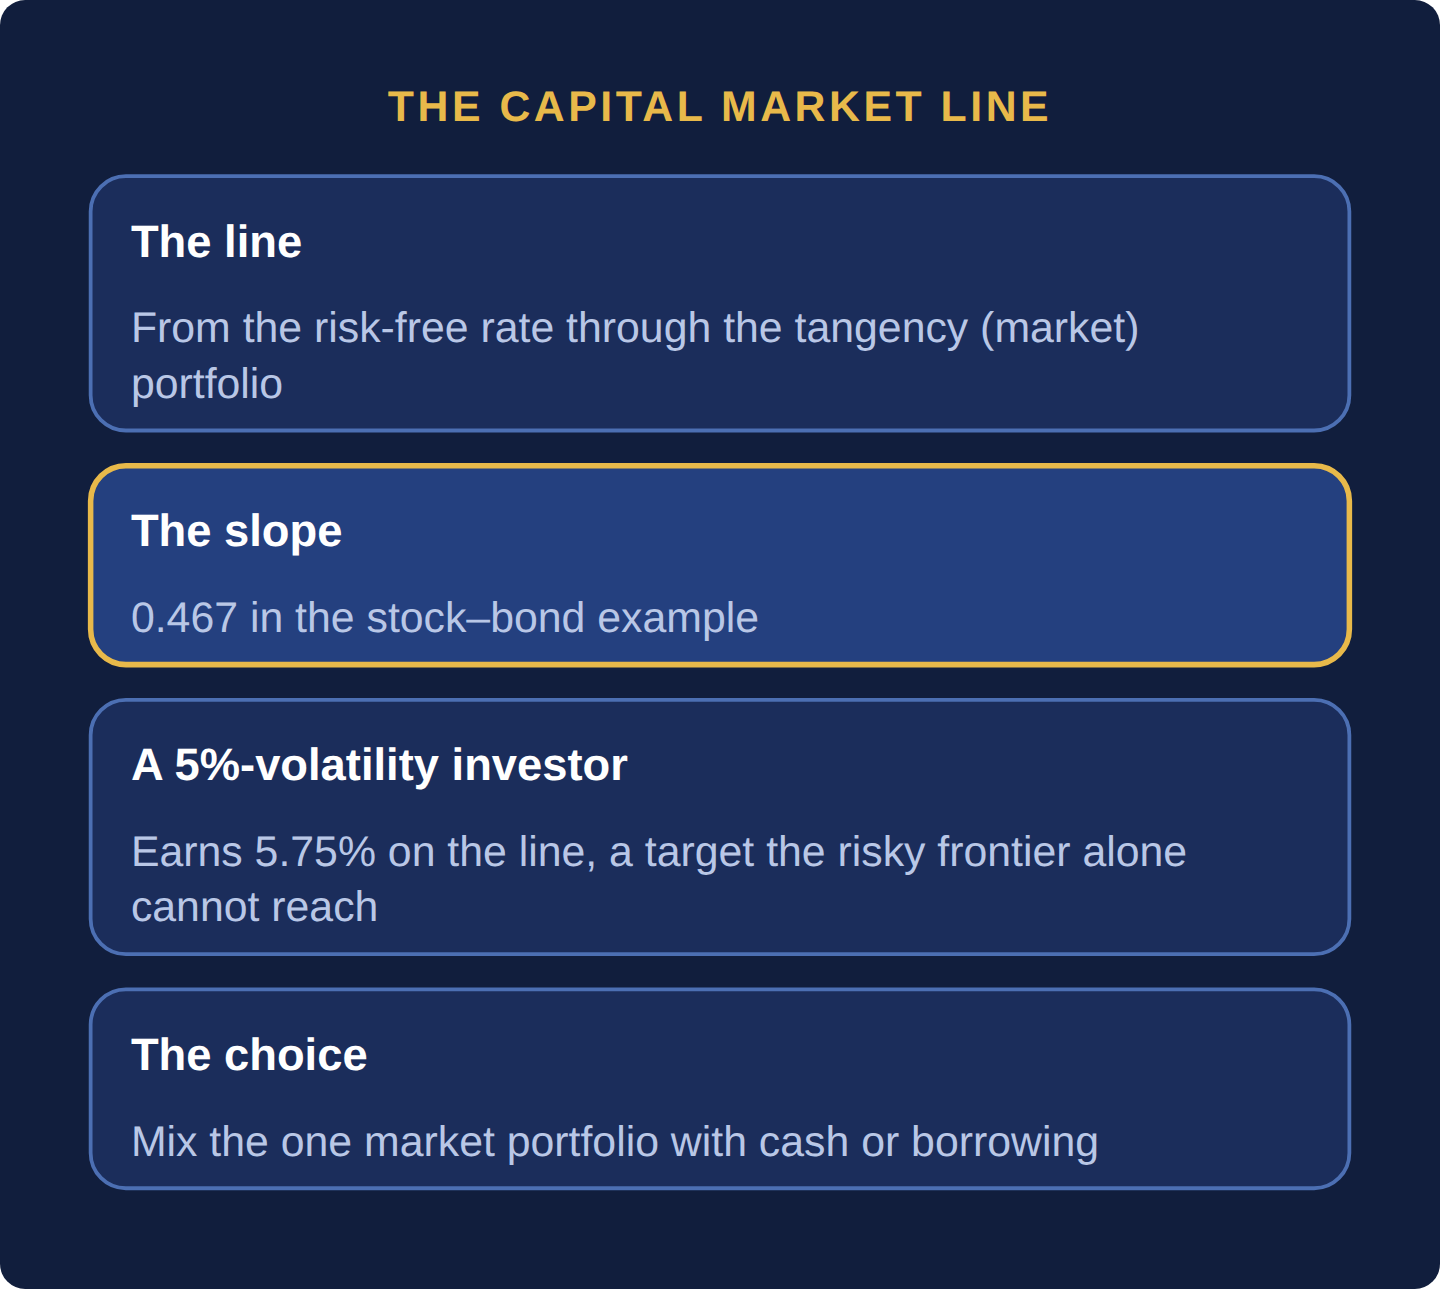
- CML: E(Rp) = Rf + [(E(RT) − Rf) ÷ σT] × σp; in the stock–bond example the slope is 0.467.
- A 5%-volatility investor earns 5.75% on the CML, a target the risky frontier alone cannot reach.
- Levering the tangency portfolio beats 100% stocks only if borrowing costs less than about 4.18%.
- Active share = ½ × Σ|fund weight − benchmark weight|; tracking error = σ of active returns.
- SPIVA: 92.9% of US active large-cap funds trailed the S&P 500 over the 20 years to 2025.
Once a risk-free asset (the Rf from CAPM, Section 1.5: CAPM — The Cost of Equity) is added to the picture, the efficient frontier transforms into a straight line called the Capital Market Line (CML), running from the risk-free rate through a single special point on the frontier: the market portfolio — theoretically, every risky asset in the world, held in proportion to its total market value. The core implication, sometimes called the two-fund separation theorem: every rational investor, regardless of their personal risk appetite, should hold some combination of just two things — the risk-free asset and this single market portfolio — adjusting only the mix between the two to suit their own risk tolerance, never changing the composition of the risky portion itself.
This theoretical result is the intellectual foundation for index investing: if, as the theory assumes, the market portfolio is already optimally diversified, a low-cost fund tracking the broad market is a defensible, theory-backed default for the risky portion of nearly any portfolio.
The CML is E(Rp) = Rf + [(E(RT) − Rf) ÷ σT] × σp, where T is the tangency portfolio: the frontier mix with the highest Sharpe ratio, which plays the market portfolio’s role in a two-asset world. With the Section 5.2: Modern Portfolio Theory & the Efficient Frontier inputs, T holds 50.9% stocks and 49.1% bonds: E(RT) = 8.40%, σT = 10.67%, so the slope is (8.40% − 3.41%) ÷ 10.67% = 0.467.
- A cautious investor targeting 5% volatility cannot reach it on the risky frontier at all (its minimum is 7.37%). On the CML she holds 5 ÷ 10.67 = 46.9% in T and 53.1% in Treasury bills, for 3.41% + 0.467 × 5% = 5.75%.
- An aggressive investor accepting 19.40% volatility earns 11.85% in all stocks, but 3.41% + 0.467 × 19.40% = 12.47% by holding 182% of T, borrowing the extra 82% at the Treasury-bill rate. The 0.62-point edge disappears if borrowing costs more than 4.18%, a break-even that most individual investors exceed.
Index funds and their active rivals are judged by two further numbers. Tracking error is the standard deviation of the fund’s return minus its benchmark’s return: active returns of +2.0, −1.5, +3.0, −2.5 and +1.0 points over five years average +0.40 points with a standard deviation of 2.33, so tracking error is 2.33%. Active share (Cremers and Petajisto, 2009) is half the sum of the absolute differences between the fund’s and the benchmark’s weights: a fund holding 50/20/15/15 in four stocks whose benchmark weights are 40/30/20/10 has active share ½ × (10 + 10 + 5 + 5) = 15%. An index fund aims for tracking error near zero and active share near 0%; a fund that charges active fees while holding a portfolio close to its benchmark is called a closet indexer.
The case for passive. Sharpe, “The Arithmetic of Active Management” (1991) shows that before costs the average actively managed dollar must earn the same as the average passively managed dollar, so after costs it must earn less. The data agree: S&P Dow Jones Indices, SPIVA U.S. Year-End 2025 found that 79% of active large-cap funds trailed the S&P 500 in 2025, 85.6% over 10 years and 92.9% over 20 years.
The case against a purely passive market. Grossman and Stiglitz (1980) showed that prices cannot fully reflect information, because then no one would be paid to collect it; some active investors must earn back their costs for prices to stay informative. The 2013 economics prize was shared by Eugene Fama, the leading advocate of efficient markets, Robert Shiller, a leading critic, and Lars Peter Hansen, for showing that prices cannot be predicted over days or weeks but are partly predictable over three to five years (Nobel Prize press release, October 14, 2013).
Where that leaves you. The evidence supports low-cost index funds as the default; the open question is whether the minority of managers who beat them can be identified in advance.
Choose the risky portfolio once (broad, diversified, low cost), then set your risk by the split between it and cash, not by changing what the risky part holds. Before paying for active management, divide the fee premium over an index fund by the fund’s active share: that is the annual cost per dollar actually managed actively. If it exceeds about 3% a year, the active positions must beat the benchmark by more than that just to break even, so choose the index fund unless you have specific evidence of skill.
Paying active fees for a closet index fund. Take a fund with 15% active share charging 0.85% a year against a 0.05% index fund (illustrative fees). On $500,000 the fee gap is 0.80% × $500,000 = $4,000 a year, but only 15% × $500,000 = $75,000 is invested differently from the index, so you pay $4,000 ÷ $75,000 = 5.33% a year on the active slice. Check active share before the fee.
What is the difference between the Capital Market Line and the Security Market Line?
The Capital Market Line plots expected return against total volatility and applies to efficient portfolios that mix cash with the market (tangency) portfolio. The Security Market Line, from CAPM, plots expected return against beta and applies to any single asset or portfolio. Individual stocks sit on the SML but below the CML, because their diversifiable risk earns no premium.
What is tracking error?
Tracking error is the standard deviation of a fund’s returns minus its benchmark’s returns, usually annualized. A fund that beats its index by +2.0, −1.5, +3.0, −2.5 and +1.0 points in five years has a tracking error of 2.33%. Index funds aim for near zero; an active fund needs some, or it cannot outperform.
Why do most active funds underperform index funds?
Mostly arithmetic. Before costs, active investors as a group own the market and earn its return; after higher fees and trading costs, the average active dollar must trail the index. SPIVA data show 92.9% of US active large-cap funds trailed the S&P 500 over the 20 years to 2025.
With a risk-free asset, the best portfolios lie on the Capital Market Line through the tangency portfolio, and investors set risk by the cash or borrowing mix rather than by changing the risky holdings. Tracking error and active share measure how far a fund departs from its index, and Sharpe’s arithmetic and SPIVA data show most active funds trail their index after costs.
Six questions on this chapter. Decide on your answer first, then click “Reveal Answer.”
1. The risk-free rate is 3%, and the tangency portfolio has an expected return of 9% and volatility of 12%. An investor targets 6% volatility on the Capital Market Line. What does she earn and hold?
- 4.5% expected, with 50% in the tangency portfolio
- 7.5% expected, with 50% in the tangency portfolio
- 6.0% expected, with 25% in the tangency portfolio
- 6.0% expected, with 50% in the tangency portfolio
Reveal Answer
Answer: D. Weight = 6% ÷ 12% = 50%; expected return = 3% + (9% − 3%) ÷ 12% × 6% = 6.0%.
2. A fund holds three stocks at 30/30/40; its benchmark holds them at 50/30/20. What is the fund’s active share?
- 60%
- 20%
- 40%
- 10%
Reveal Answer
Answer: B. Active share = ½ × (|30 − 50| + |30 − 30| + |40 − 20|) = ½ × 40 = 20%. Forgetting the one-half gives 40%.
3. What is the core of William Sharpe’s 1991 “arithmetic of active management”?
- Before costs active dollars earn the market return, so after costs they earn less
- Active managers lose because prices always reflect all available information perfectly
- Active managers as a group beat the market whenever the overall market is falling
- Index funds win because index providers choose better stocks than active managers do
Reveal Answer
Answer: A. Active and passive investors together hold the market, so their average returns before costs must match; higher active costs then guarantee underperformance on average.
4. How does the Capital Market Line differ from CAPM’s Security Market Line?
- It plots efficient portfolios against downside deviation instead of against total volatility
- It plots single assets against beta instead of efficient portfolios against total volatility
- It plots efficient portfolios against total volatility instead of single assets against beta
- It plots active funds against tracking error instead of single assets against beta
Reveal Answer
Answer: C. The CML applies to efficient portfolios of cash and the market portfolio; the SML prices any asset by its systematic risk (beta).
5. Worked problem: The risk-free rate is 3% and the tangency portfolio has an expected return of 9% and volatility of 14%. What is the slope of the Capital Market Line?
Reveal Answer
Answer: Slope = (9% − 3%) ÷ 14% = 0.429.
6. Worked problem: What return does the CML offer an investor who wants 7% volatility?
Reveal Answer
Answer: E(R) = 3% + 0.429 × 7% = 6.0%, which is half in the tangency portfolio and half in cash.
5.4 The Sharpe Ratio & Risk-Adjusted Return
The Sharpe ratio asks how much extra return you got for each unit of risk. It takes a portfolio’s return above the risk-free rate and divides it by its volatility, so funds with different risk can be compared fairly. A fund with a higher Sharpe ratio could be levered up to match a riskier fund’s volatility and would earn more. Other measures, called Treynor, Sortino and information ratios, answer different questions, and they can rank the same two funds in opposite order.
Why it matters: A high return means little until you know how much risk it took.
Summary: The Sharpe ratio divides a portfolio’s return above the risk-free rate by its volatility, so funds with different risk can be compared. A fund with a higher Sharpe ratio can be levered to match a riskier fund’s volatility and earn more. Treynor, Sortino and information ratios answer different questions, and they can rank the same two funds in opposite order.
- Sharpe = (R − Rf) ÷ σ; at a 4% risk-free rate Fund B (0.80) beats Fund A (0.60) despite a lower return.
- Held at A’s 20% volatility, B earns 4% + 0.80 × 20% = 20%, against A’s 16%.
- Treynor uses beta, Sortino uses downside deviation, the information ratio uses tracking error against a benchmark.
- Sharpe rankings depend on the risk-free rate: A and B tie at 8%.
- Choose the ratio by the decision, and compare only ratios built on the same frequency and period.

Comparing two investments purely by their raw returns is misleading if they carry very different levels of risk. The Sharpe ratio, developed by William Sharpe, standardizes this comparison by measuring return earned per unit of risk taken.
Sharpe Ratio = (Portfolio Return − Risk-Free Rate) ÷ Portfolio Standard Deviation
Fund A returns 16% with a standard deviation of 20%; Fund B returns 12% with a standard deviation of 10%. Assume a 4% risk-free rate (the 3-month Treasury bill averaged 4.21% in 2025): Fund A’s Sharpe ratio = (16% − 4%) ÷ 20% = 0.60. Fund B’s Sharpe ratio = (12% − 4%) ÷ 10% = 0.80. Despite Fund A’s higher headline return, Fund B delivered more return per unit of risk taken, which raw returns alone would have obscured. The ratio matters because risk can be rescaled: borrowing to hold Fund B at A’s 20% volatility (2× leverage at the risk-free rate) would earn 4% + 0.80 × 20% = 20%, four points more than Fund A for the same volatility.
Illustrative inputs: Fund A returns 16% with σ = 20%, beta 1.25, downside deviation 9% and tracking error 9%; Fund B returns 12% with σ = 10%, beta 0.55, downside deviation 7% and tracking error 8%. Both are measured against a benchmark that returned 13%, with a 4% risk-free rate. Downside deviation is the standard deviation of returns below a target (here the risk-free rate); tracking error is defined in Section 5.3: The Capital Market Line & the Market Portfolio.
| Ratio | Formula | Fund A | Fund B | Question it answers |
|---|---|---|---|---|
| Sharpe ratio | (R − Rf) ÷ σ | (16 − 4) ÷ 20 = 0.60 | (12 − 4) ÷ 10 = 0.80 | Which is the better whole portfolio? |
| Treynor ratio | (R − Rf) ÷ β | 12 ÷ 1.25 = 9.6% | 8 ÷ 0.55 = 14.5% | Which adds more to an already diversified portfolio? |
| Sortino ratio | (R − Rf) ÷ downside deviation | 12 ÷ 9 = 1.33 | 8 ÷ 7 = 1.14 | Which earns more per unit of bad volatility? |
| Information ratio | (R − Rb) ÷ tracking error | 3 ÷ 9 = 0.33 | −1 ÷ 8 = −0.13 | Which manager adds value against the benchmark? |
B wins on Sharpe and Treynor; A wins on Sortino, because more of its volatility is on the upside, and on the information ratio, because B is a low-beta fund that trailed its index. Rankings also move with the risk-free rate: the two Sharpe ratios are equal when (16 − Rf) ÷ 20 = (12 − Rf) ÷ 10, that is at Rf = 8%, where both equal 0.40; above 8%, Fund A ranks first.
Choose the ratio by the decision. Use Sharpe when the fund will be most of your risky money; Treynor when it is one sleeve among many; the information ratio when you are hiring a manager against a benchmark; Sortino when returns are visibly skewed. Compute every ratio from the same frequency and period, annualizing a monthly Sharpe ratio by multiplying by √12. Require at least 36 monthly observations before ranking. Ignore Sharpe ratios built on smoothed, appraisal-based prices or on strategies that sell options, whose volatility looks low until the loss arrives.
Ranking funds on raw return. In the example, choosing Fund A for its 16% gives up the 20% that Fund B delivers at the same 20% volatility when held with 2× leverage at the risk-free rate: four points a year. Compounded on $1 million for ten years, $1 million × (1.2010 − 1.1610) = $6.19 million − $4.41 million = $1.78 million. Real borrowing costs more than the risk-free rate, which shrinks the gap, but the ranking error remains. Compare risk-matched returns, not headline returns.
What is a good Sharpe ratio?
There is no universal threshold, so compare with what broad markets deliver. Using annual US data for 1928–2025, stocks earned (11.85% − 3.41%) ÷ 19.40% = 0.44 and a 60/40 portfolio about 0.46. A long-run Sharpe ratio well above that deserves scrutiny of how volatility was measured, especially for strategies holding illiquid assets or selling options.
What is the difference between the Sharpe and Sortino ratios?
The Sharpe ratio divides excess return by total volatility, penalizing large gains and large losses equally. The Sortino ratio divides by downside deviation, which counts only returns below a target such as the risk-free rate. Funds with positively skewed returns rank better on Sortino: Fund A is second on Sharpe (0.60 against 0.80) but first on Sortino (1.33 against 1.14).
Can a Sharpe ratio be negative?
Yes, whenever the fund returns less than the risk-free rate. Negative Sharpe ratios rank badly: a more volatile fund with the same shortfall gets a ratio closer to zero and looks better, which is the opposite of what an investor wants. When excess returns are negative, compare the shortfalls and volatilities directly instead.
The Sharpe ratio measures excess return per unit of volatility, and a higher-Sharpe fund can be levered to beat a higher-return fund at equal risk. Treynor, Sortino and information ratios answer different questions and can reverse the ranking, so choose the ratio by the decision being made.
Six questions on this chapter. Decide on your answer first, then click “Reveal Answer.”
1. Fund C returns 14% with σ 16%; Fund D returns 10% with σ 8%; the risk-free rate is 4%. Which has the higher Sharpe ratio, and at what risk-free rate would they tie?
- C (0.63 against 0.75); they tie at 6%
- D (0.75 against 0.63); they tie at 6%
- C (0.88 against 0.50); they never tie
- D (0.75 against 0.63); they tie at 8%
Reveal Answer
Answer: B. C = (14 − 4) ÷ 16 = 0.625; D = (10 − 4) ÷ 8 = 0.75. Setting (14 − r) ÷ 16 = (10 − r) ÷ 8 gives r = 6%.
2. A fund returns 12% with a beta of 0.8 when the risk-free rate is 4%. What is its Treynor ratio?
- 15%
- 8%
- 6.4%
- 10%
Reveal Answer
Answer: D. Treynor = (R − Rf) ÷ β = (12% − 4%) ÷ 0.8 = 10%. 15% divides the total return by beta; 8% ignores beta.
3. A pension fund is hiring a manager to beat a specific index. Which ratio fits that decision best?
- The Sharpe ratio
- The Treynor ratio
- The information ratio
- The Sortino ratio
Reveal Answer
Answer: C. The information ratio divides return above the benchmark by tracking error, so it measures value added relative to the index the manager is hired to beat.
4. Fund B has a lower return but a higher Sharpe ratio than Fund A. Why can B still be the better choice at A’s level of risk?
- B can be levered to A’s volatility and would then earn more than A
- Regulators allow only higher-Sharpe funds to use any leverage
- B compounds faster because lower volatility always raises returns
- B’s beta is always higher, so it earns the larger market premium
Reveal Answer
Answer: A. At 2× leverage at the risk-free rate, B earns 4% + 0.80 × 20% = 20% at 20% volatility, against A’s 16% at the same volatility.
5. Worked problem: Fund A returned 12% with 15% volatility and the risk-free rate is 3%. What is its Sharpe ratio?
Reveal Answer
Answer: Sharpe = (12% − 3%) ÷ 15% = 0.60.
6. Worked problem: Fund B has a Sharpe ratio of 0.70. Levered to 20% volatility, what return does it earn?
Reveal Answer
Answer: Return = 3% + 0.70 × 20% = 17%.
- Sharpe (1964), Capital Asset Prices: A Theory of Market Equilibrium under Conditions of Risk, The Journal of Finance — Capital asset pricing and the market portfolio
- Markowitz (1952), Portfolio Selection, The Journal of Finance — The efficient frontier on which the Capital Market Line builds
- Sharpe (1966), Mutual Fund Performance, The Journal of Business — The paper that introduced the reward-to-variability ratio, later called the Sharpe ratio